
The AstroSpectro project journey reached a major milestone today. What began as a modest baseline with 32% accuracy has become, after a series of rigorous scientific iterations, a high-performance stellar classifier reaching 84% accuracy. This post retraces the key steps, discoveries, and lessons learned along the way.
Act I: The 32% Baseline — A Proof of Concept
Our starting point was a simple model trained on 5,000 spectra with only four features: the presence or absence of the Hα, Hβ, and CaII H & K lines. The result, 32%, was more than three times better than chance and validated our pipeline. However, analysing the results revealed two major weaknesses:
- a strong class imbalance,
- features that were too often absent, especially Hα.
(For more details, see my first results post).
Act II: The Feature Engineering Era — Toward 75%
The roadmap was clear: we needed to enrich our features. Each new idea was tested methodically:
- From Presence to Strength (Prominence): Measuring line depth raised accuracy to 40%.
- The Power of Ratios: Adding strength ratios between lines (e.g. CaII K / Hβ) pushed the score to 50%.
- Context Through Metadata: Including FITS header metadata (redshift, SNR, seeing) produced a spectacular breakthrough, reaching 71%.
- Line Shape (FWHM & Skewness): Adding the full width at half maximum (FWHM) further refined the model. We also tested line asymmetry (skewness). While FWHM proved to be a highly relevant indicator, skewness did not improve performance. The analysis showed that this measure was too sensitive to residual noise, even after smoothing, so the model learned to ignore it. This is an important lesson: not all physical features are necessarily useful for an AI model.
- Robustness Through Cross-Validation: Integrating
GridSearchCVmade it possible to find the best hyperparameters and stabilize performance around a very solid 75%.
Each step confirmed the same principle: the more physical and contextual information we gave the model, the better it performed.
The Key Tool: Interactive Debugging
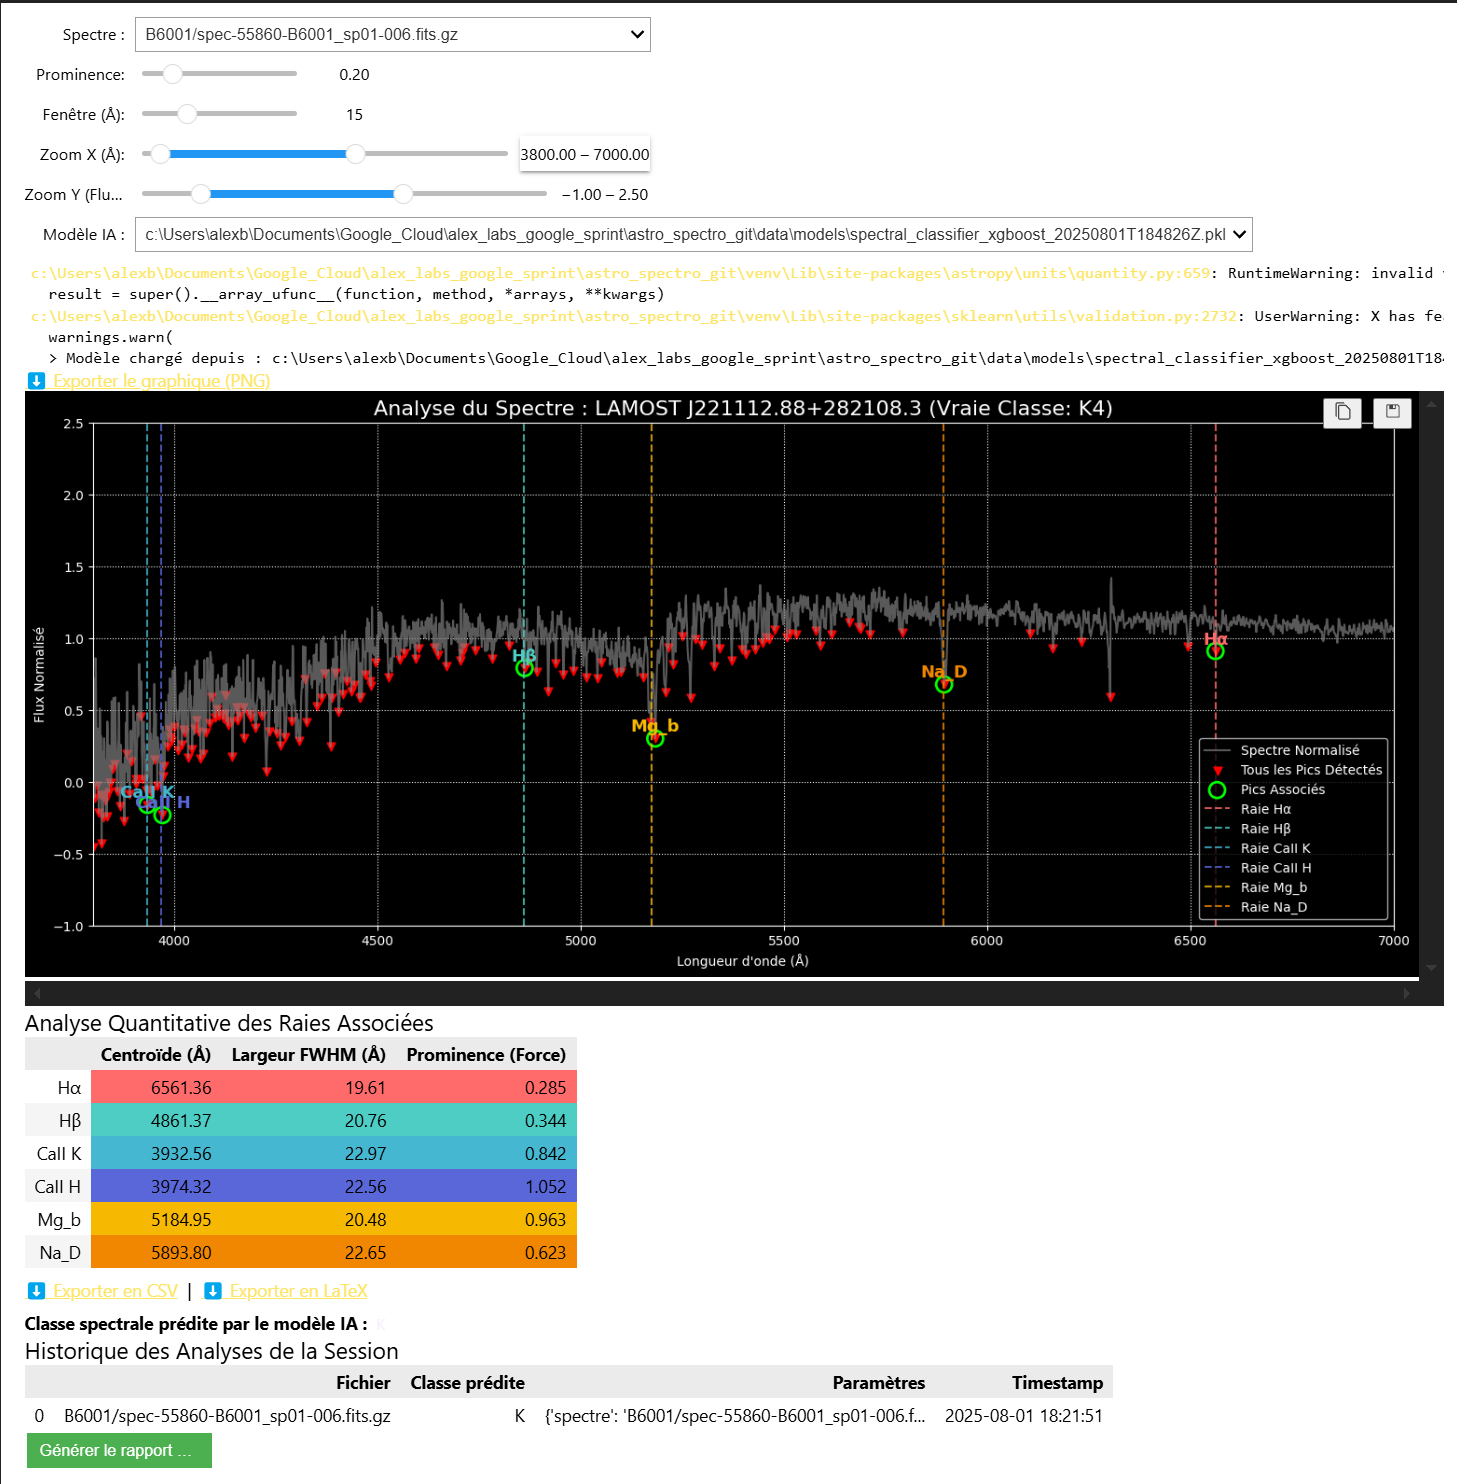
This progress would not have been possible without the visualization tools developed in parallel. Our Augmented Spectrum Analyzer became the core of our research process, allowing us to:
- Visualize any spectrum in our collection.
- Tune peak-detection parameters in real time.
- Compare a star's “true” class with the model prediction live.
This tool allowed us to identify that our initial detection parameters were too strict, causing us to miss crucial information.
Act III: The XGBoost Challenger — The Breakthrough to 84%
With a rich and robust feature set, it was time to test a more powerful model. We replaced the RandomForest with XGBoost, a gradient boosting algorithm renowned for its performance.
The result was immediate and spectacular.
- Cross-Validation Score: 82.3%
- Final accuracy on the test set: 84%
View the final results in detail
--- Evaluation Report (XGBoost) ---
             precision  recall   f1-score   support
A              0.85      0.79      0.82        29
F              0.79      0.79      0.79        98
G              0.82      0.80      0.81       143
K              0.77      0.85      0.81       101
M              0.94      0.82      0.88        57
N              0.97      1.00      0.99        69

accuracy                           0.84       497
macro avg      0.86      0.84      0.85       497
weighted avg   0.84      0.84      0.84       497
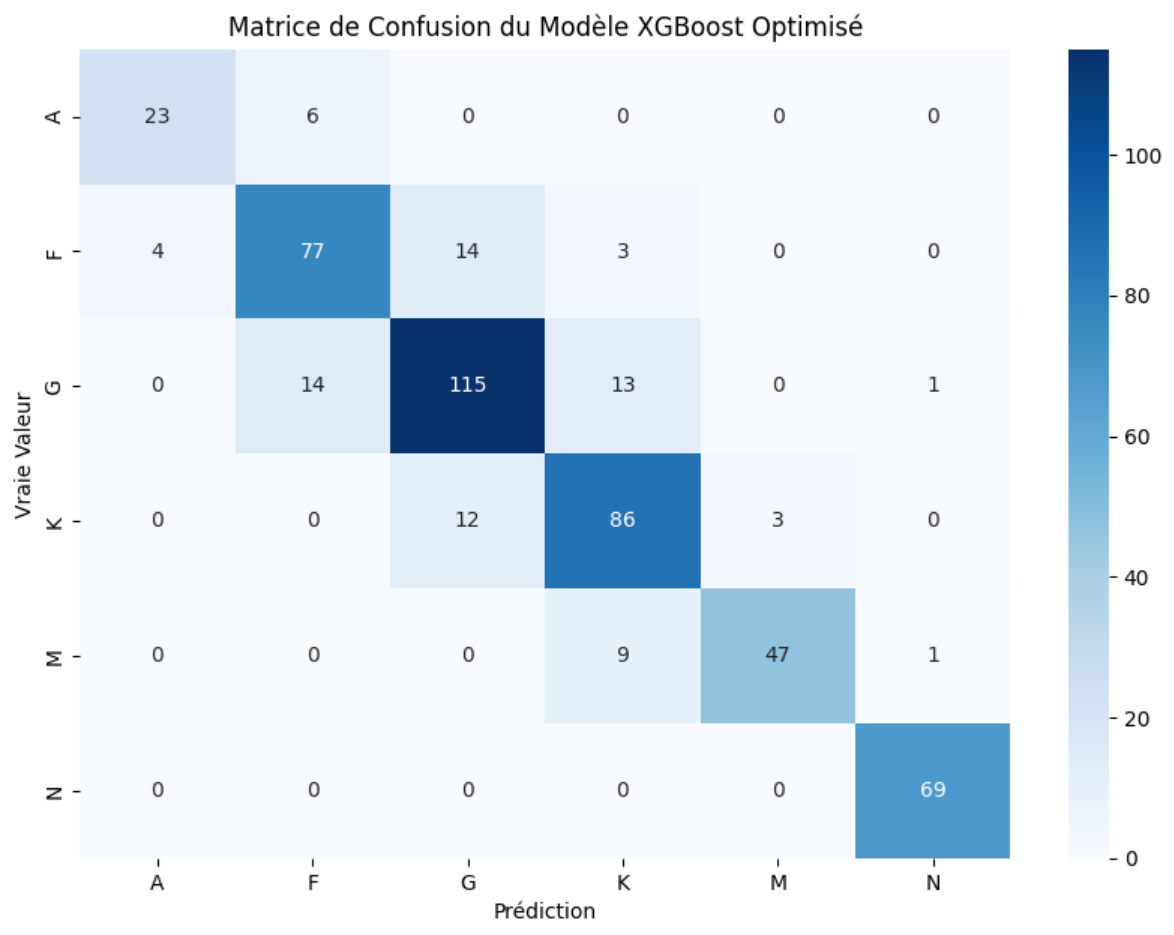
The final confusion matrix shows a dominant diagonal, the sign of an extremely confident and accurate model. Confusion between adjacent classes was minimized, and performance is excellent across all major stellar types.
Anatomy of the Decision: Which Features Matter Most?
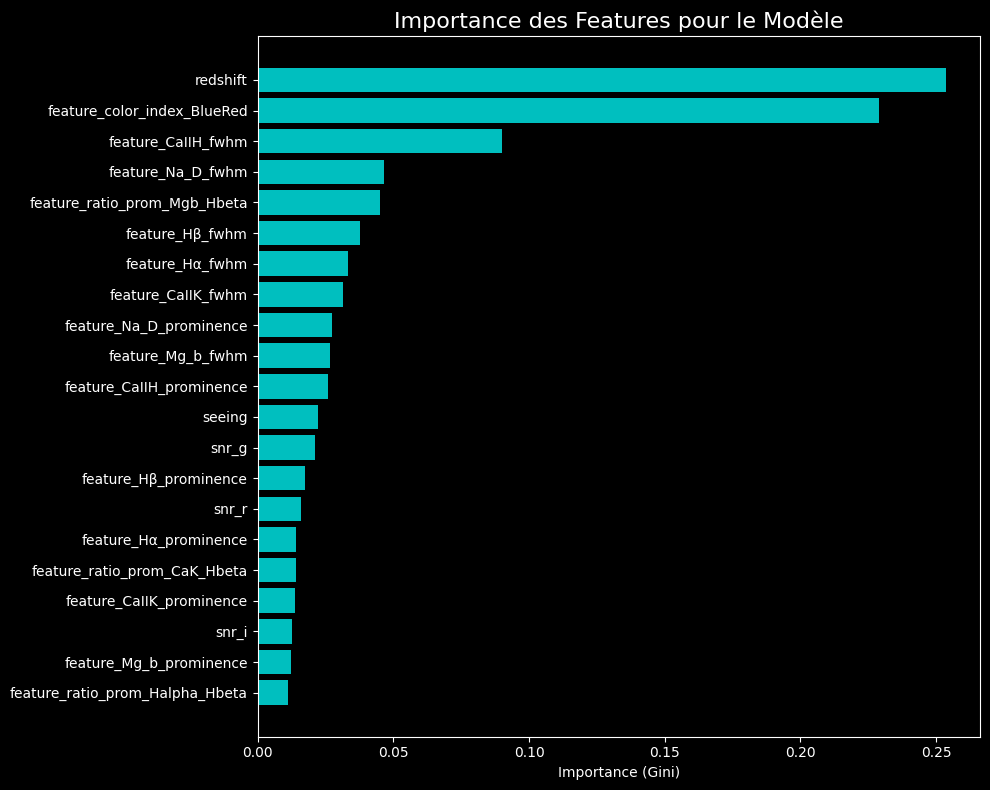
The feature-importance plot for our final XGBoost model reveals a fascinating hierarchy. Contextual metadata such as redshift_error and the colour index dominate, but they are immediately followed by the physical measurements we extracted, such as the width (FWHM) and strength (prominence) of the Hα and Hβ lines. This confirms that the best performance is achieved by combining the observational context with the physical properties of the spectrum.
Conclusion: The Convergence of Physics and AI
This journey from 32% to 84% is not just the story of an improving score. It demonstrates that a rigorous approach combining:
- A robust modular software architecture.
- Feature engineering guided by astrophysical domain knowledge.
- Interactive visualization tools for debugging and analysis.
- Rigorous statistical validation of models.
...can produce very high-quality results.
The AstroSpectro project has reached its main objective. The laboratory is built, the tools are sharpened, and the results are here. The adventure, of course, is only beginning. The Roadmap is still full of exciting challenges.
Perspectives
- New models to test: CNNs, spectral transformers.
- Greater dataset diversity: extension to DR6, SDSS...
- Full pipeline automation (CI/CD).
- Streamlit app: toward an online interactive classification interface.
🚀 Want to contribute?
Fork the project, suggest your ideas, or contact me!