Non-parametric Morphometrics
GalaxyMorphometry computes the classical non-parametric statistics used in galaxy-structure studies on a single image. They need no training and give interpretable, physically grounded descriptors to compare with learned features.
Method
- Convert RGB to luminance (0.299 R + 0.587 G + 0.114 B).
- Subtract the sky level (10th percentile of pixel values).
- Build the galaxy mask: Otsu threshold on the background-subtracted image, fill holes, keep the largest connected component. The centre is the flux-weighted centre of mass.
| Statistic | Definition (reference) | Reading |
|---|---|---|
| C concentration | 5 log₁₀(r₈₀ / r₂₀) (Conselice 2003) | higher = flux concentrated toward the centre |
| A asymmetry | Σ|I − I₁₈₀| / (2 Σ|I|) (Abraham 1996) | higher = disturbed or merging |
| S smoothness | Σ|I − I_smooth| / Σ|I| (Gaussian σ = 3 px) | higher = clumpy, high-frequency structure |
| Gini | inequality of flux among pixels (Lotz 2004) | near 1 = a few pixels carry most flux |
| M20 | log₁₀ of the second-order moment of the brightest 20 % of pixels over the total | more negative = concentrated; near 0 = several bright nuclei |
| Petrosian radius, Sérsic n | η = 0.2 radius; 1-D radial-profile fit | length scale; profile shape |
batch_morphometry processes a random sub-sample (seed 42, max_n = 5,000 by default): 5,000 galaxies, of which 4,999 have all six statistics.
Medians by class
| Class | C | A | S | Gini | M20 | n (galaxies) |
|---|---|---|---|---|---|---|
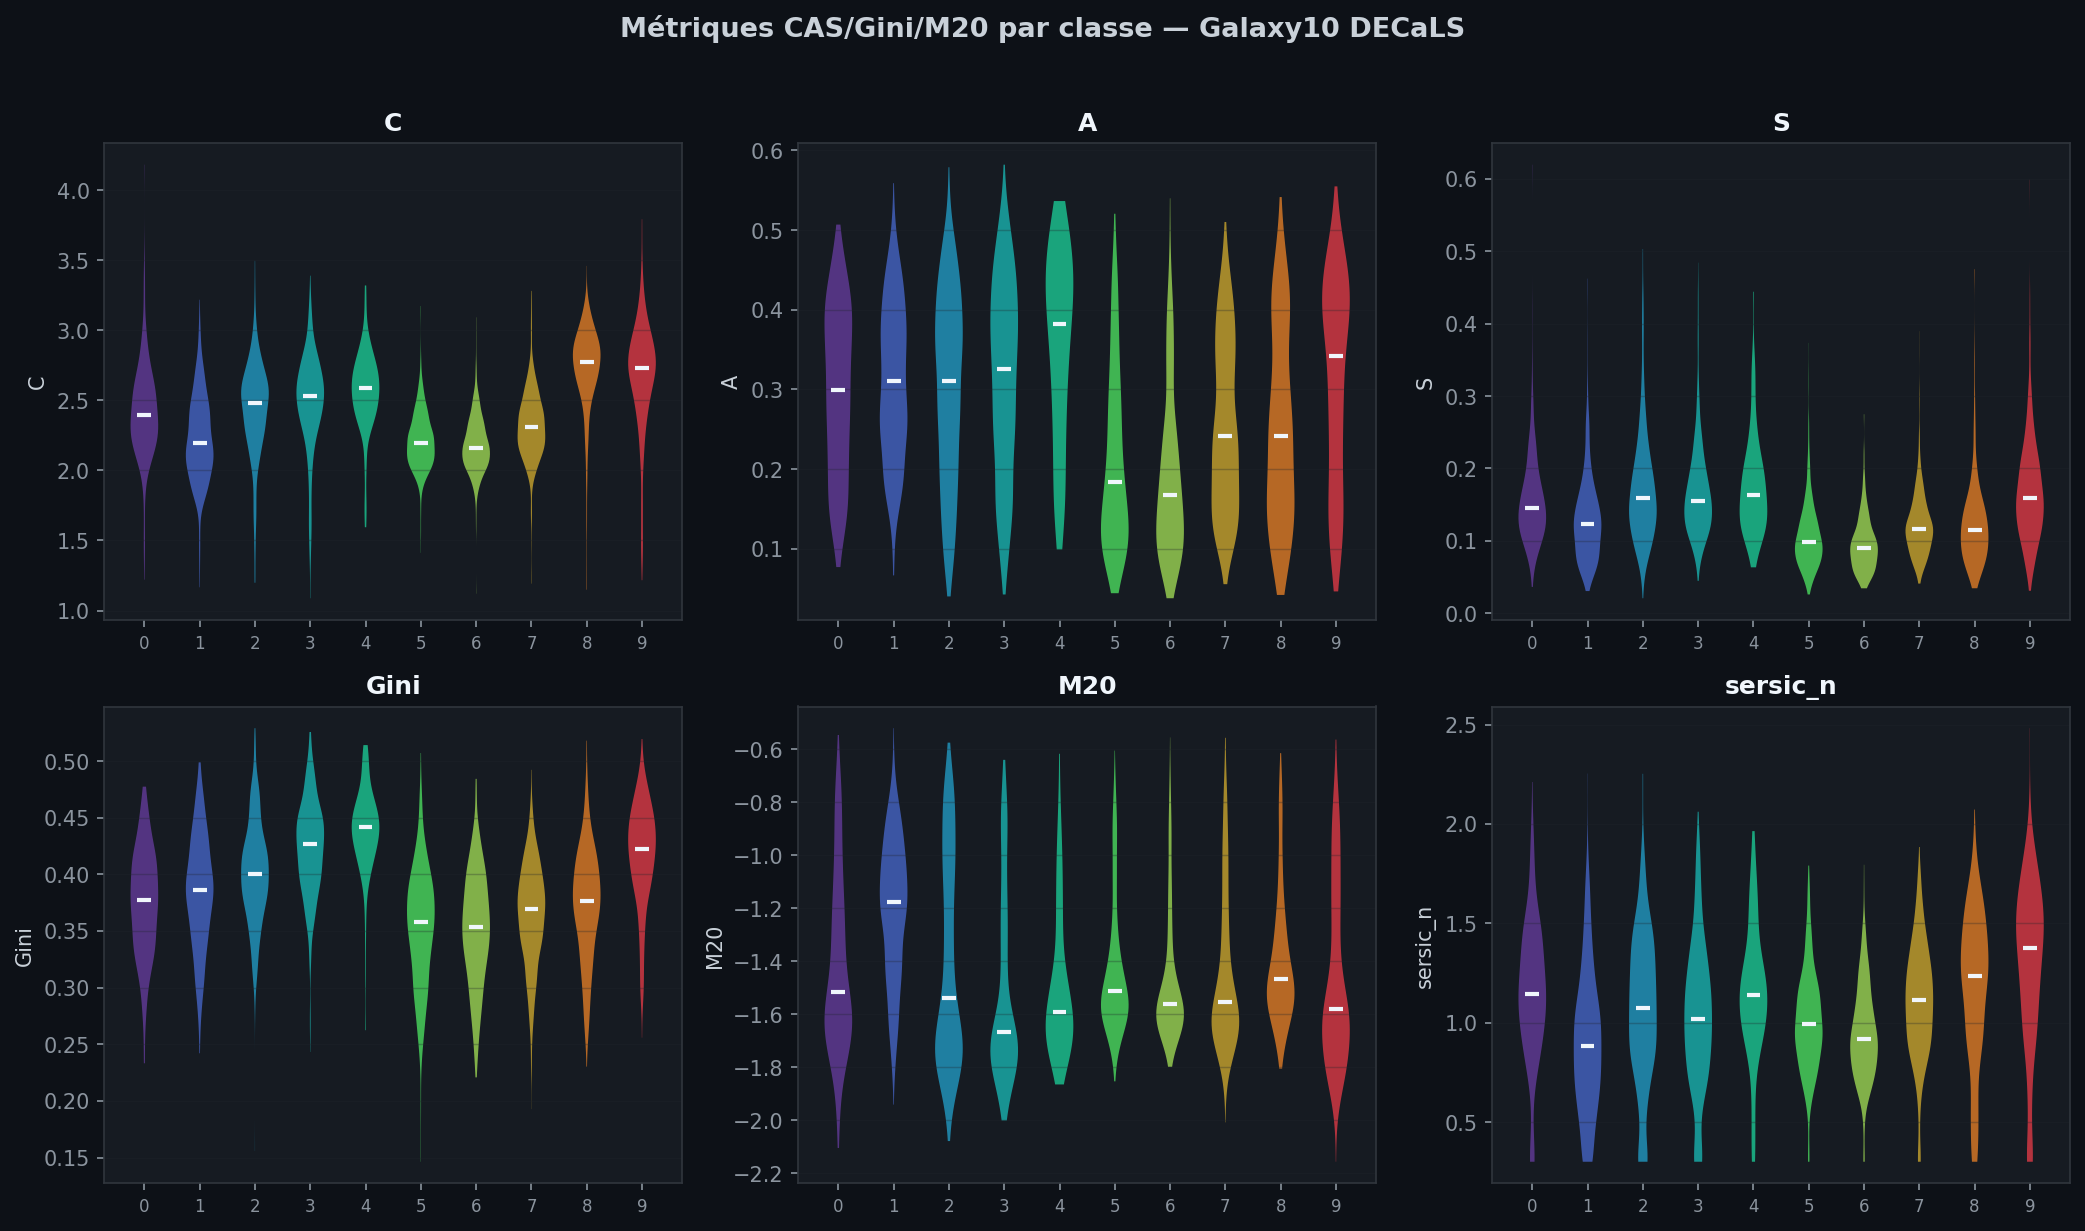
| 0 · Disturbed | 2.39 | 0.30 | 0.15 | 0.377 | −1.51 | 302 |
| 1 · Merging | 2.20 | 0.31 | 0.12 | 0.387 | −1.18 | 524 |
| 2 · Round Smooth | 2.48 | 0.31 | 0.16 | 0.400 | −1.54 | 748 |
| 3 · In-between Round Smooth | 2.53 | 0.33 | 0.16 | 0.426 | −1.67 | 547 |
| 4 · Cigar Shaped Smooth | 2.59 | 0.38 | 0.16 | 0.441 | −1.59 | 103 |
| 5 · Barred Spiral | 2.20 | 0.18 | 0.10 | 0.358 | −1.51 | 604 |
| 6 · Unbarred Tight Spiral | 2.16 | 0.17 | 0.09 | 0.353 | −1.56 | 512 |
| 7 · Unbarred Loose Spiral | 2.31 | 0.24 | 0.12 | 0.369 | −1.55 | 740 |
| 8 · Edge-on without Bulge | 2.78 | 0.24 | 0.11 | 0.376 | −1.47 | 411 |
| 9 · Edge-on with Bulge | 2.73 | 0.34 | 0.16 | 0.423 | −1.58 | 509 |
Source: data/morphometry_galaxy10.csv (class sizes follow the random sub-sample, not the full dataset).
Reading the table:
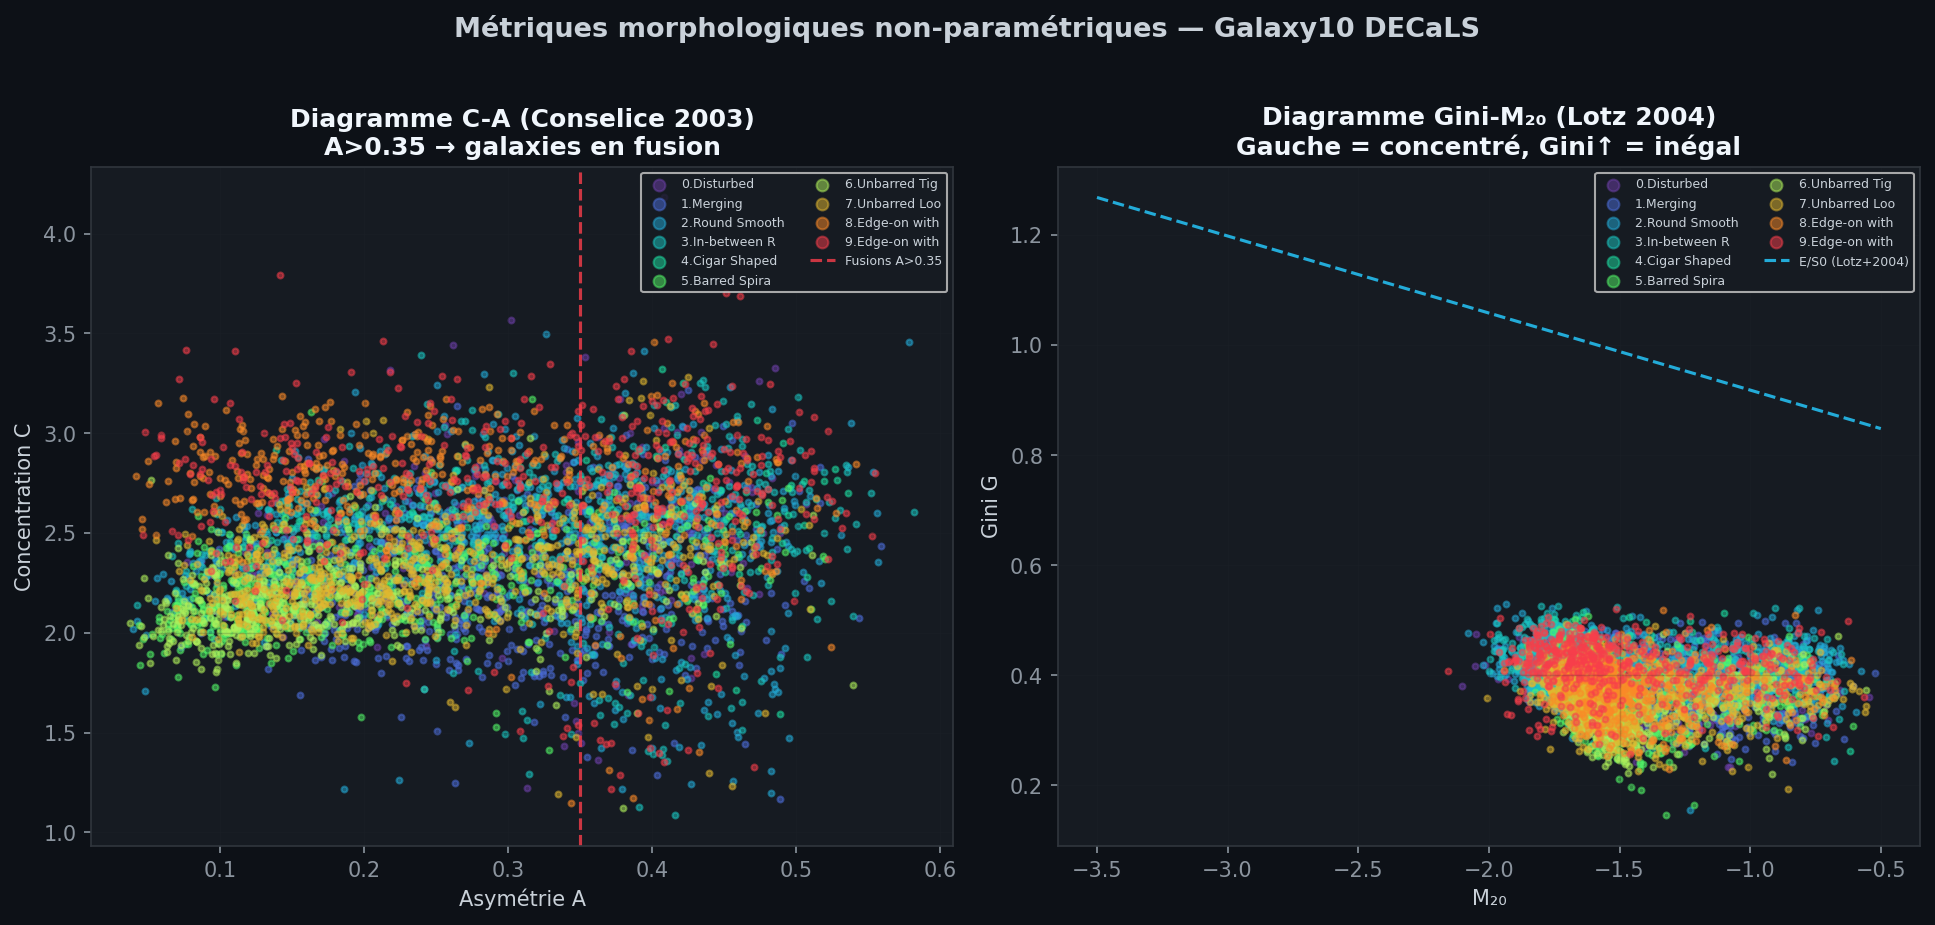
- Asymmetry is highest for Cigar Shaped Smooth (0.38) and Edge-on with Bulge (0.34) and lowest for spirals (0.17 for Unbarred Tight Spiral). Disturbed and Merging sit in the middle (0.30, 0.31), contrary to the textbook expectation that A flags disturbed systems. The notebooks do not investigate why; mask and centring effects on small cut-outs are a candidate, not a tested explanation.
- Concentration is highest for the edge-on classes (2.78 for Edge-on without Bulge) and lowest for spirals (2.16 for Unbarred Tight Spiral).
- Sérsic n stays close to 1 for every class (median 1.06 overall, 1.07 for Round Smooth), whereas smooth ellipticals should approach 4: the radial-profile proxy does not separate morphologies and should not be interpreted physically.
Mask dependence
Every statistic depends on the Otsu mask, which responds to brightness, not to galactic structure. The attention-guided variant (Attention & Grad-CAM) replaces the mask by the DINOv2 attention map; its C uses a different formula (ratio of cumulative flux in the mask), so its values are not comparable with the C of this page.
Related pages