Physical Interpretation
The central question — do DINOv2 features encode physical galaxy properties? — is tested by correlating the representation with independent measurements: morphometry (from the images) and SDSS colour (from a separate survey).
Key results
_facts/astrovision/FACTS_INDEX.md §3 and shown when hovering over a number.1 — The principal axes of DINOv2 features
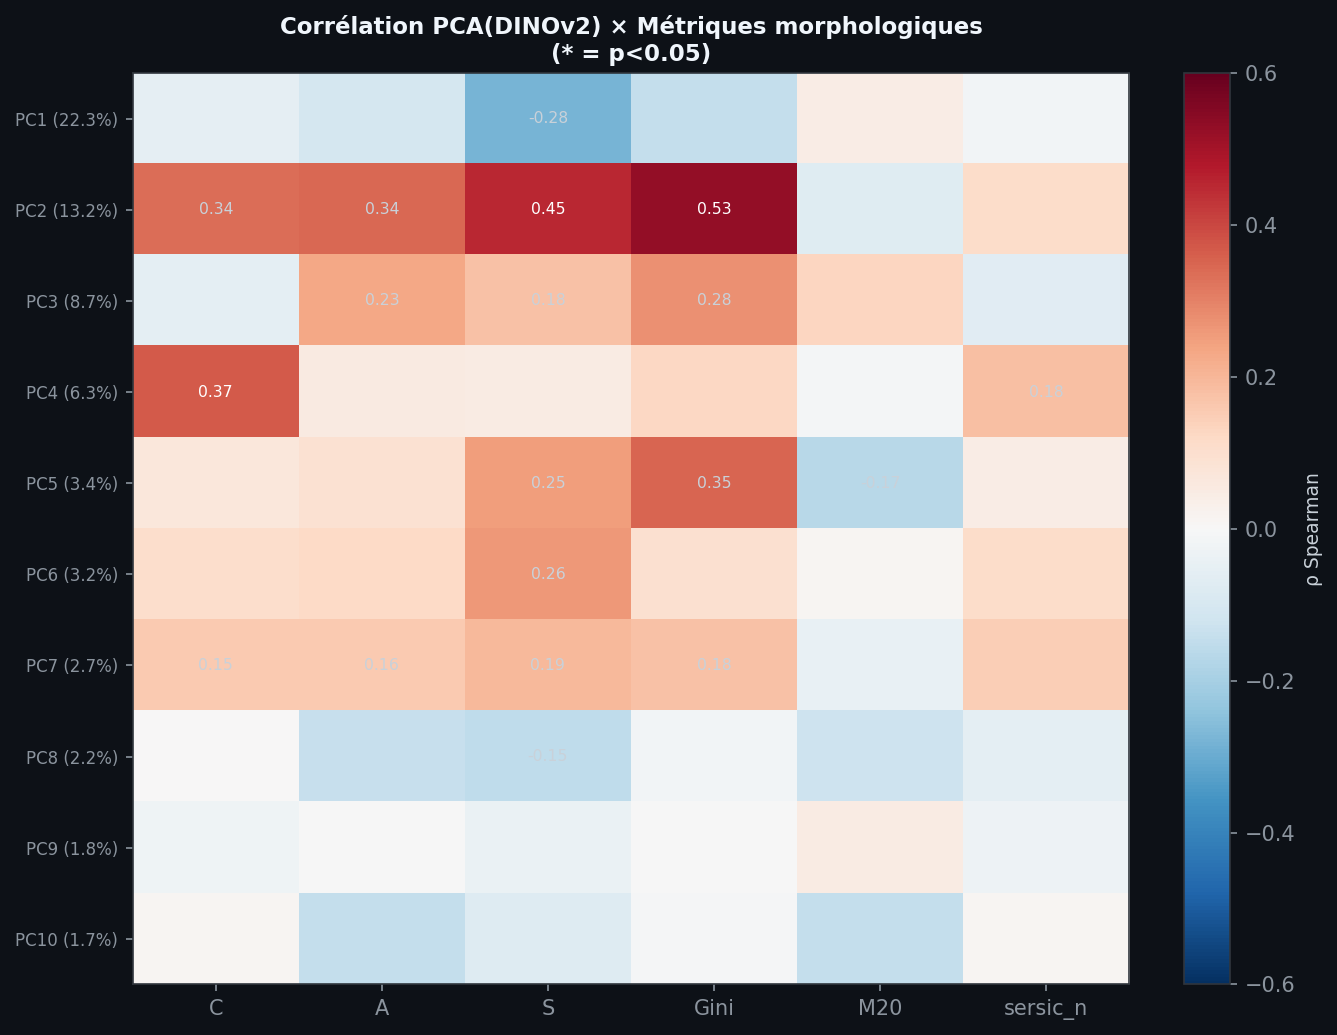
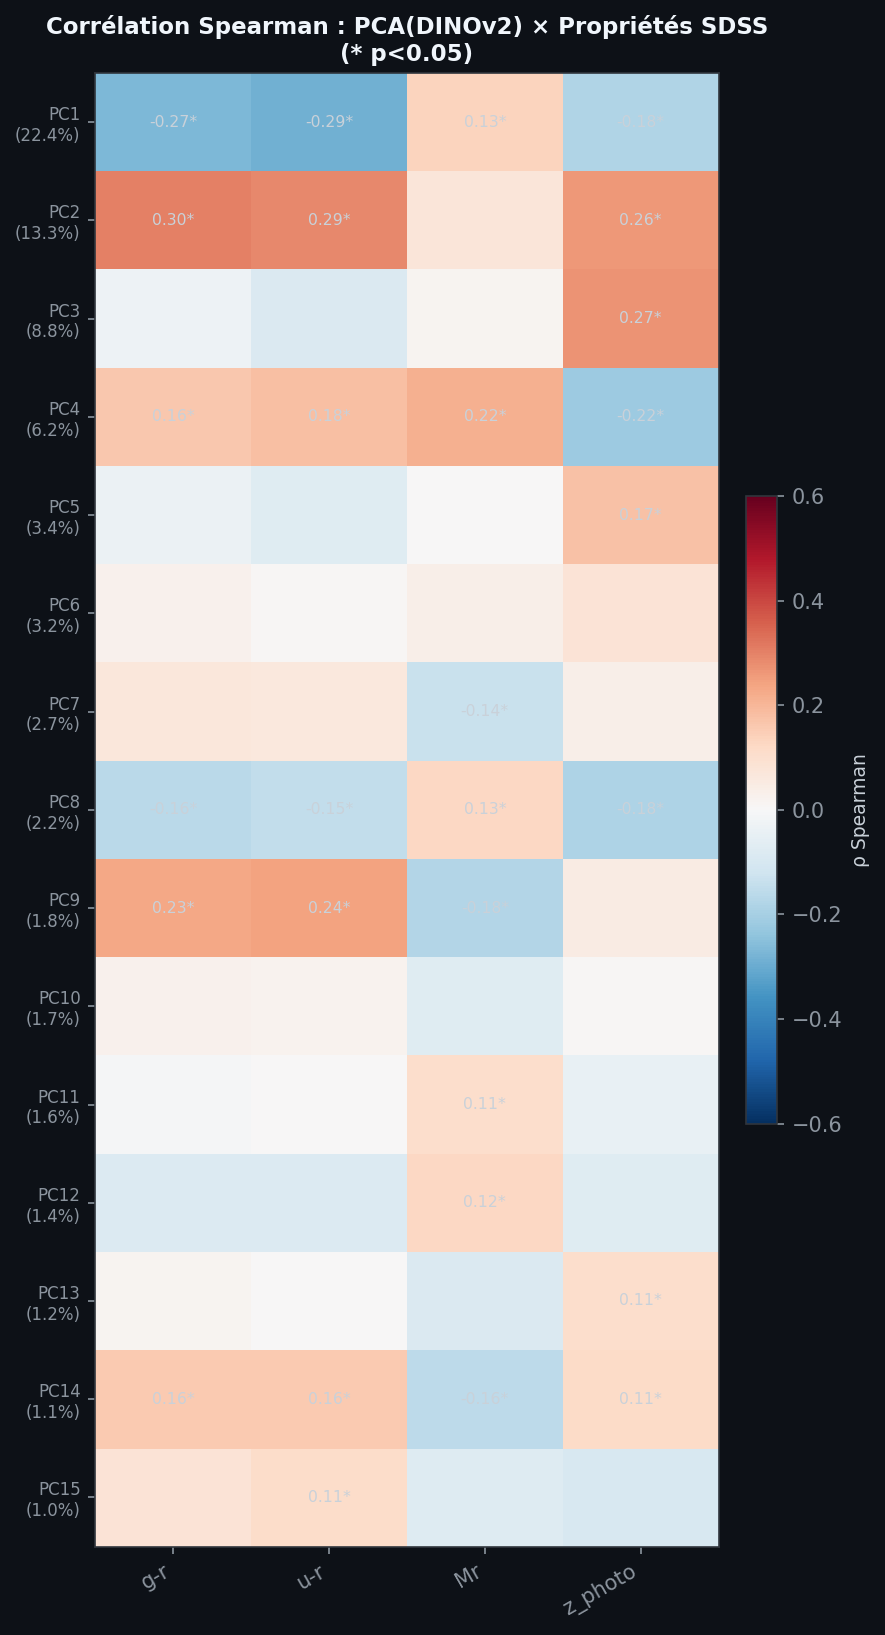
On the 4,999 galaxies with morphometry, the second principal component of the zero-shot features (PCA on L2-normalised vectors) correlates with several statistics at once: Gini (ρ = 0.53), smoothness S (0.45) and, with SDSS, g−r (0.30). PC2 carries 13.2% of the feature variance and PC1 22.3%.
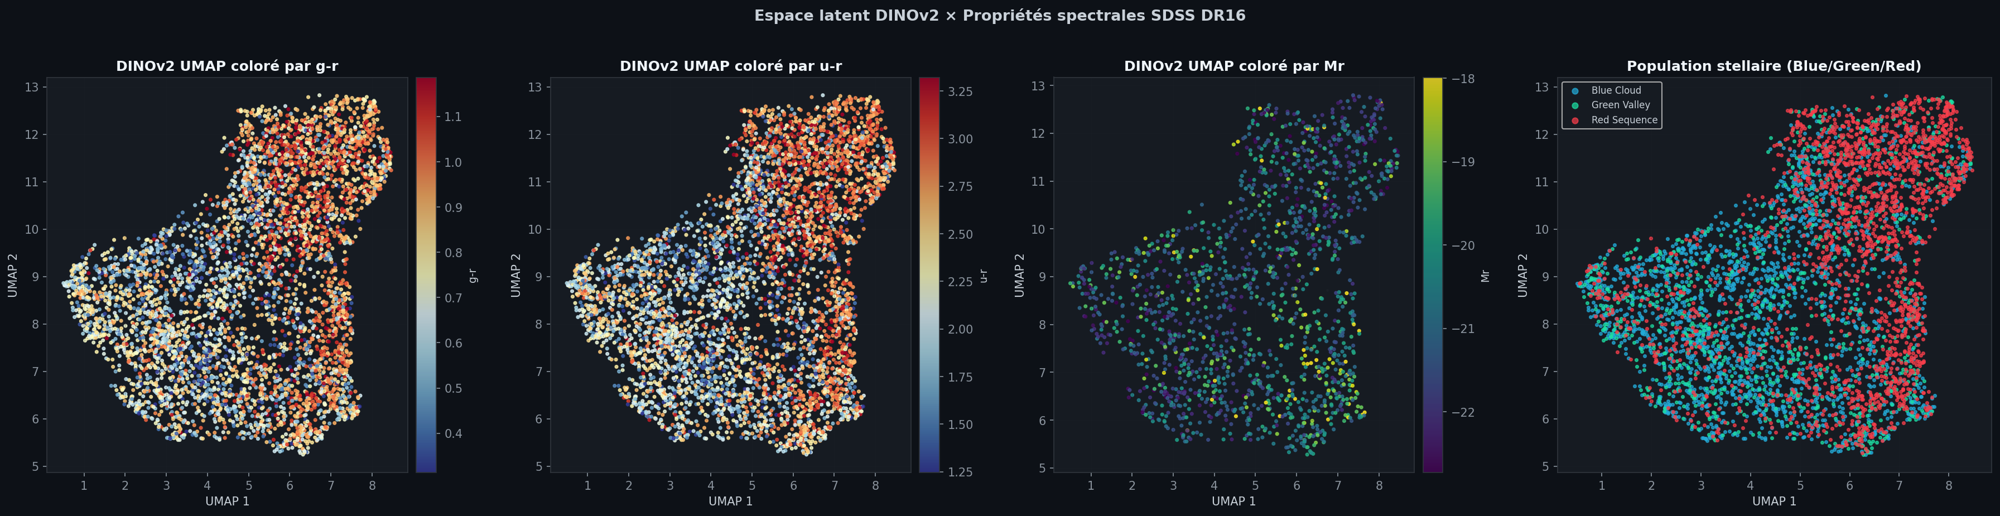
These are rank correlations of moderate size, obtained without any astronomical training of the backbone, which is the interesting part. They are consistent with the picture that concentration and colour covary along the Hubble sequence, so a feature axis that tracks morphology will correlate with both. The analysis does not control for class label, so it cannot separate "DINOv2 encodes colour" from "DINOv2 encodes morphology, which correlates with colour". Values for PC2 are read from the exported figure.
2 — Predicting colour
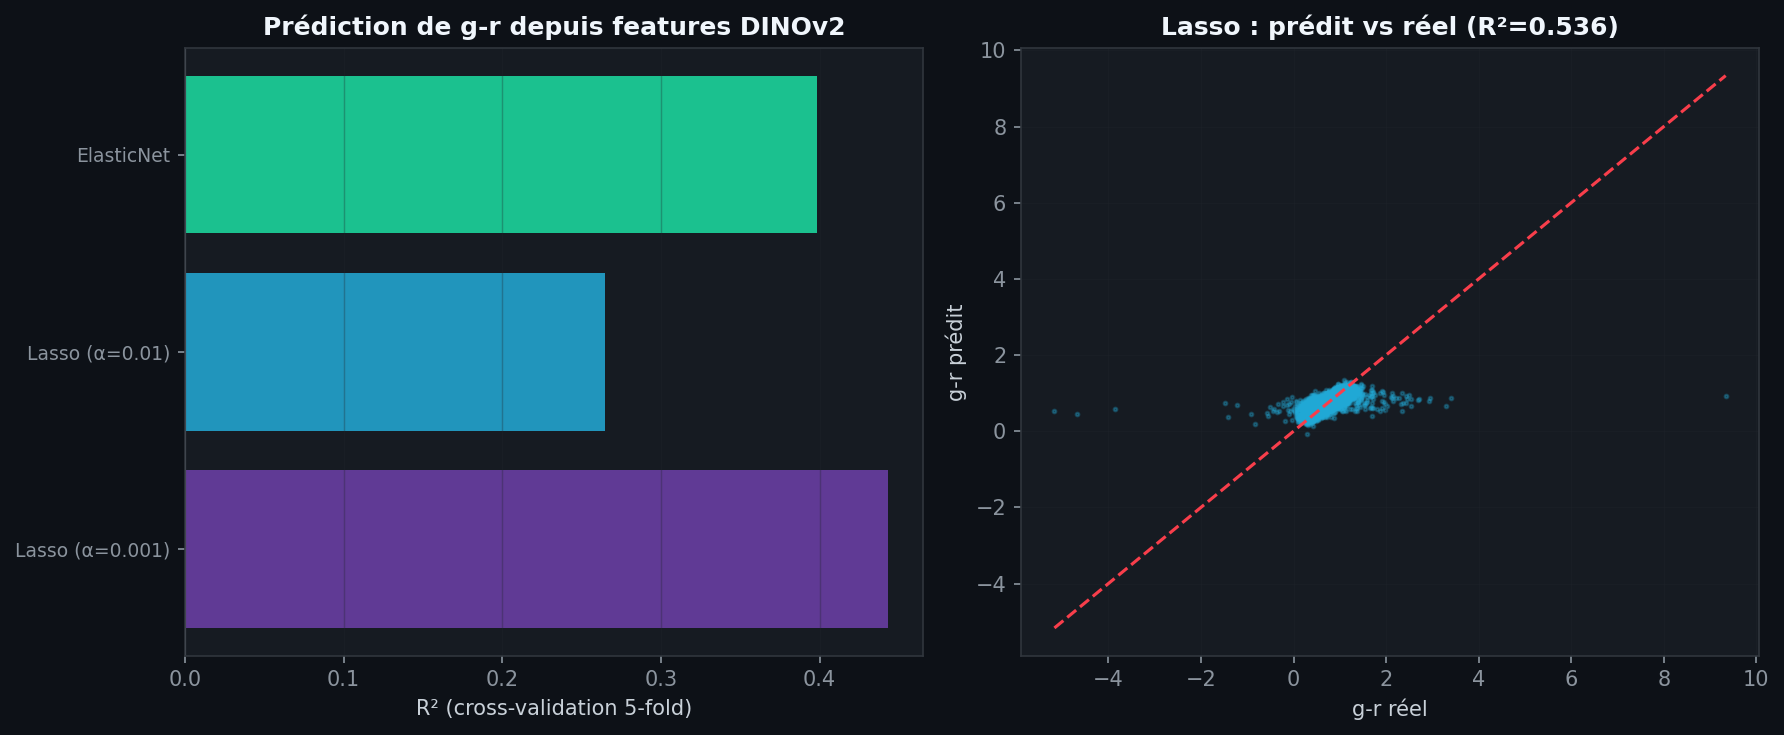
A Lasso regression of g−r on the 768 zero-shot features gives R² = 0.443 ± 0.103 across folds (315 of 768 coefficients non-zero) on 17,430 galaxies. Colour is therefore partly recoverable from visual features; more than half of its variance is not. Older descriptions quote R² = 0.536, which does not appear in the notebook output and is not used here.
3 — Colour across morphology
| Class | Median g−r | Blue cloud | Red sequence |
|---|---|---|---|
| 0 · Disturbed | 0.585 | 61% | 26% |
| 1 · Merging | 0.891 | 28% | 58% |
| 2 · Round Smooth | 0.906 | 23% | 63% |
| 3 · In-between Round Smooth | 0.867 | 26% | 58% |
| 4 · Cigar Shaped Smooth | 0.765 | 43% | 33% |
| 5 · Barred Spiral | 0.756 | 48% | 20% |
| 6 · Unbarred Tight Spiral | 0.679 | 65% | 14% |
| 7 · Unbarred Loose Spiral | 0.640 | 71% | 12% |
| 8 · Edge-on without Bulge | 0.670 | 58% | 17% |
| 9 · Edge-on with Bulge | 0.970 | 3% | 85% |
The astrophysical expectations hold: smooth and edge-on-with-bulge galaxies are mostly red, loose and tight spirals mostly blue. Disturbed galaxies are mostly blue (61%) while Merging ones are mostly red (58%), which is not what a simple "interaction triggers star formation" picture predicts; colour is a coarse photometric proxy and classes are crowd-sourced.
4 — U-Net bulge fraction: a null result
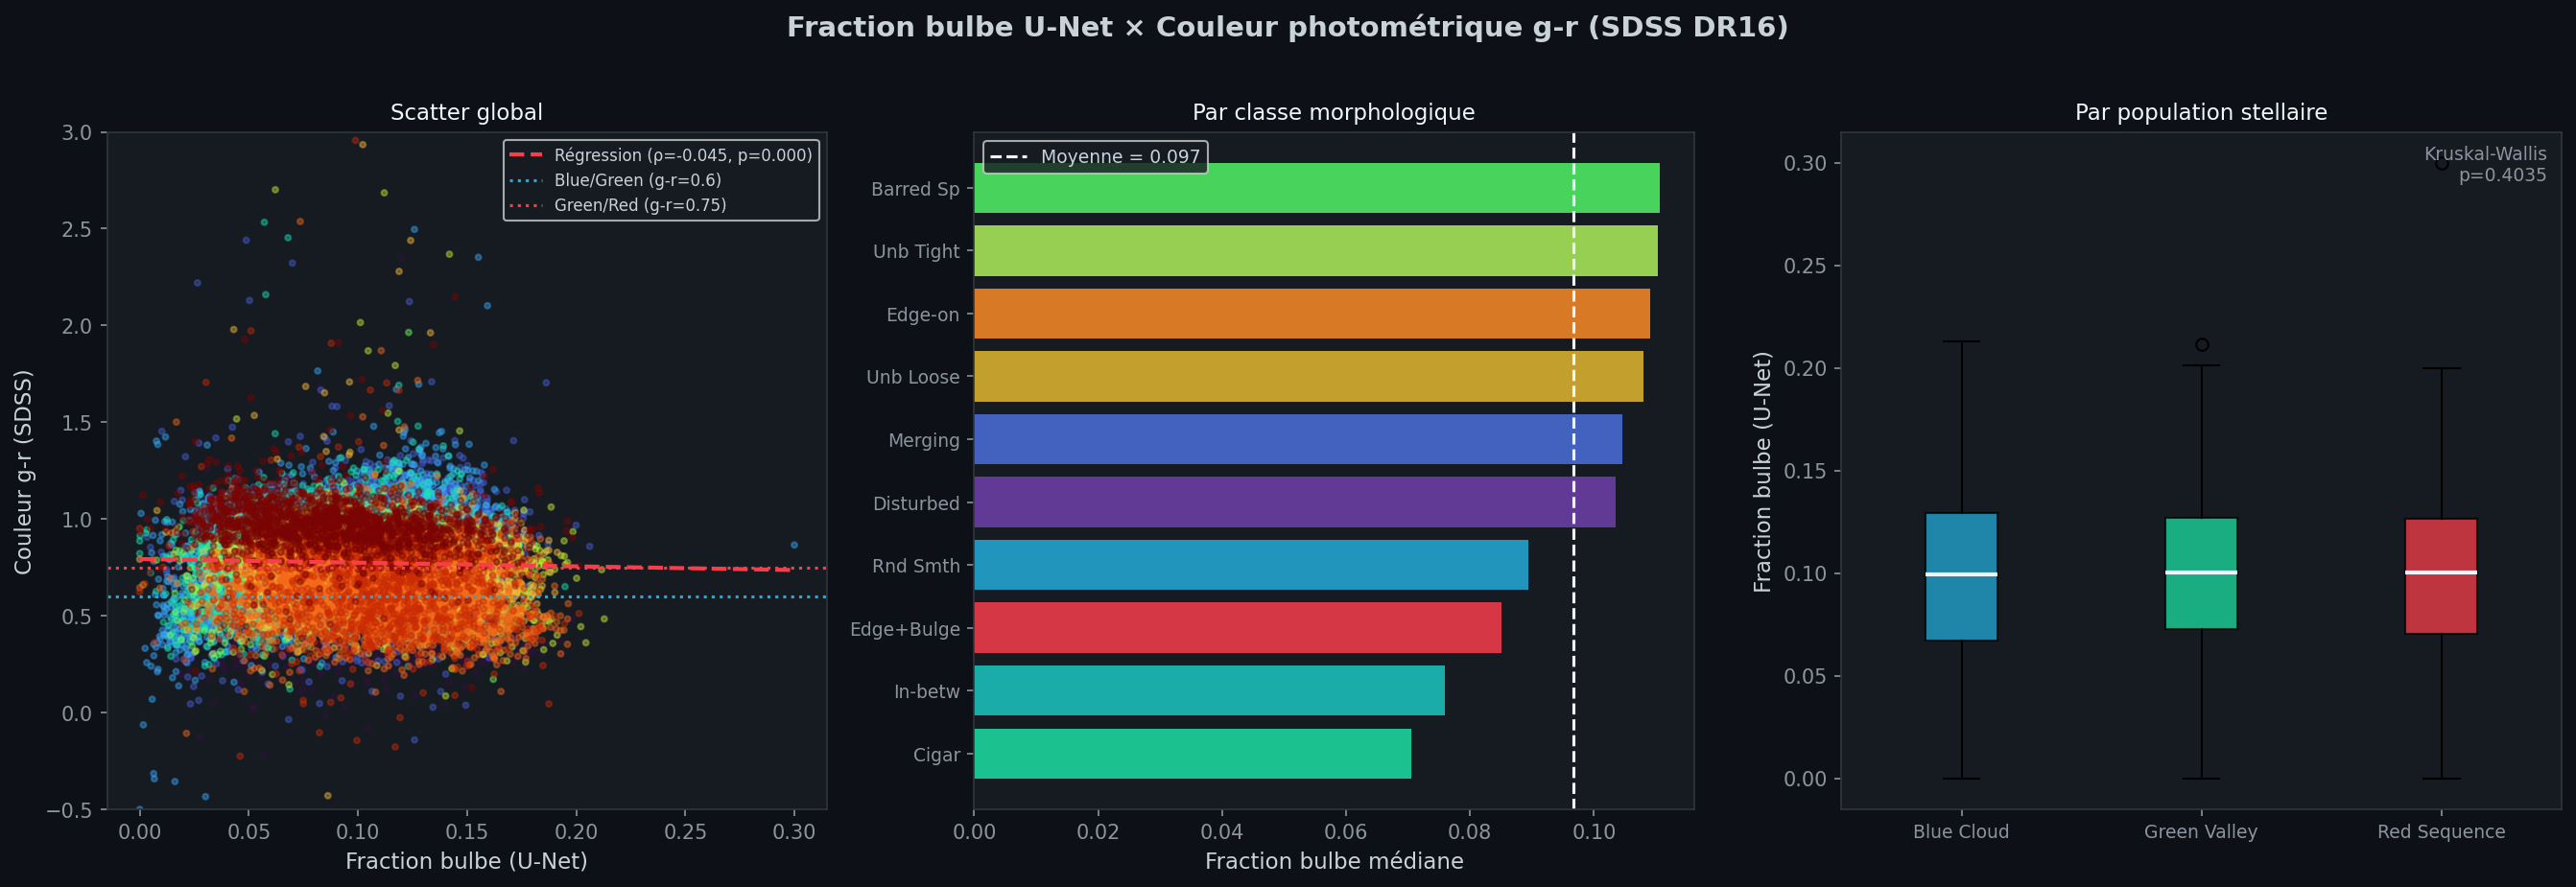
Does the bright-core fraction from the U-Net track stellar population? No:
| Spearman ρ with bulge fraction | ρ | Galaxies |
|---|---|---|
| g−r | −0.045 | 17,430 |
| Absolute magnitude Mr | −0.115 | 5,651 |
| Redshift z_photo | −0.287 | 17,601 |
The median bulge fraction is 0.100 for blue-cloud and 0.100 for red-sequence galaxies — indistinguishable. This is expected, since the "bulge" is a brightness quantile (U-Net page). The stronger correlation with redshift (ρ = −0.29) suggests an angular-size or resolution effect rather than physics.
Summary of claims
| Claim | Support | Strength |
|---|---|---|
| DINOv2 zero-shot features correlate with Gini, S and g−r | Spearman ρ, moderate (section 1) | Suggests a shared morphology–colour axis; confounded by class |
| g−r is partly predictable from the features | Lasso, cross-validated R² (section 2) | Moderate |
| Bulge fraction (U-Net) tracks stellar population | ρ close to 0 (section 4) | Not supported |
| Visual features encode metallicity | no spectroscopic data | Untested |