Uncertainty Quantification
All analyses of this page use the late-fusion model and the stratified test split of notebook 09. Three complementary tools are applied.
Key results
_facts/astrovision/FACTS_INDEX.md §3 and shown when hovering over a number.1 — MC Dropout (epistemic uncertainty)
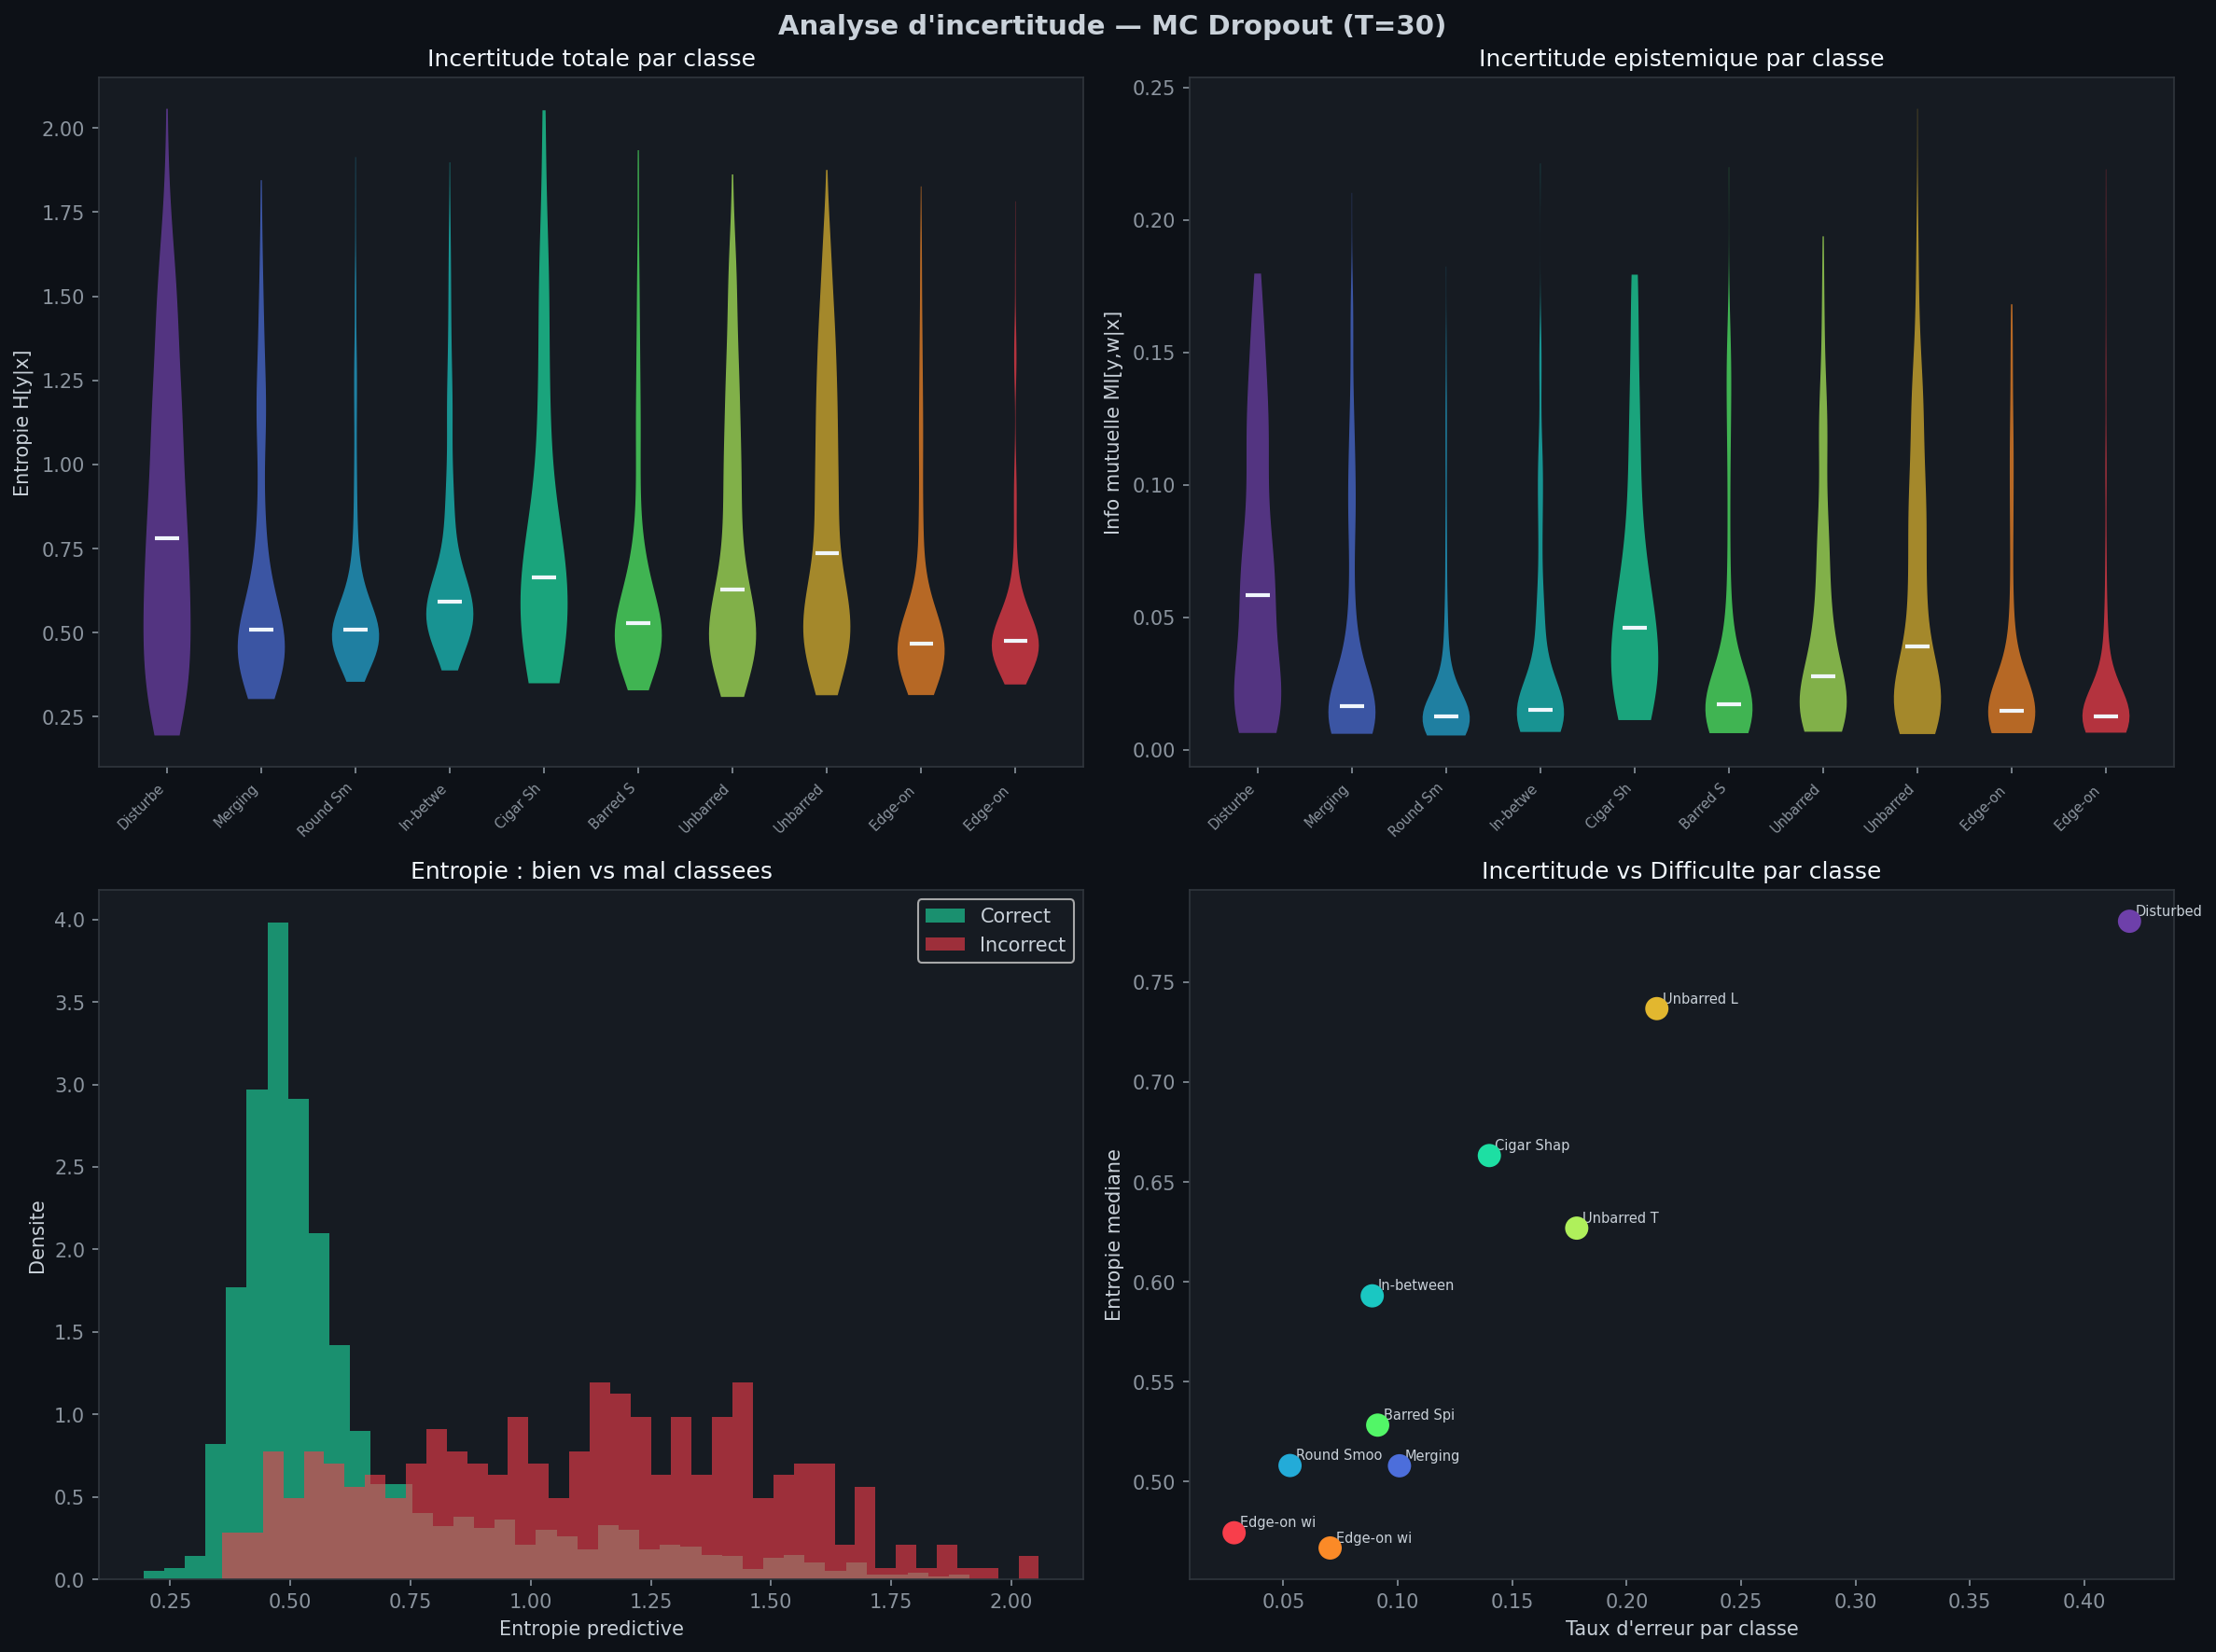
Dropout stays active at inference and the model is run 30 times. The mean probabilities give a balanced accuracy of 86.2% (the deterministic run scored 86.3%). Predictive entropy has a median of 0.54 nats; the mutual information, which isolates epistemic uncertainty, has a median of only 0.018.
Uncertainty follows class difficulty: a Kruskal–Wallis test on entropy across classes gives H = 275.8 (p ≈ 0), and the classes order as the recall tables suggest.
Disturbed (0.78) and Unbarred Loose Spiral (0.74) are the most uncertain; the edge-on classes the least. Wrongly classified galaxies have a clearly wider entropy distribution than correct ones (figure below), so entropy is a usable error flag.
2 — Temperature scaling (calibration)
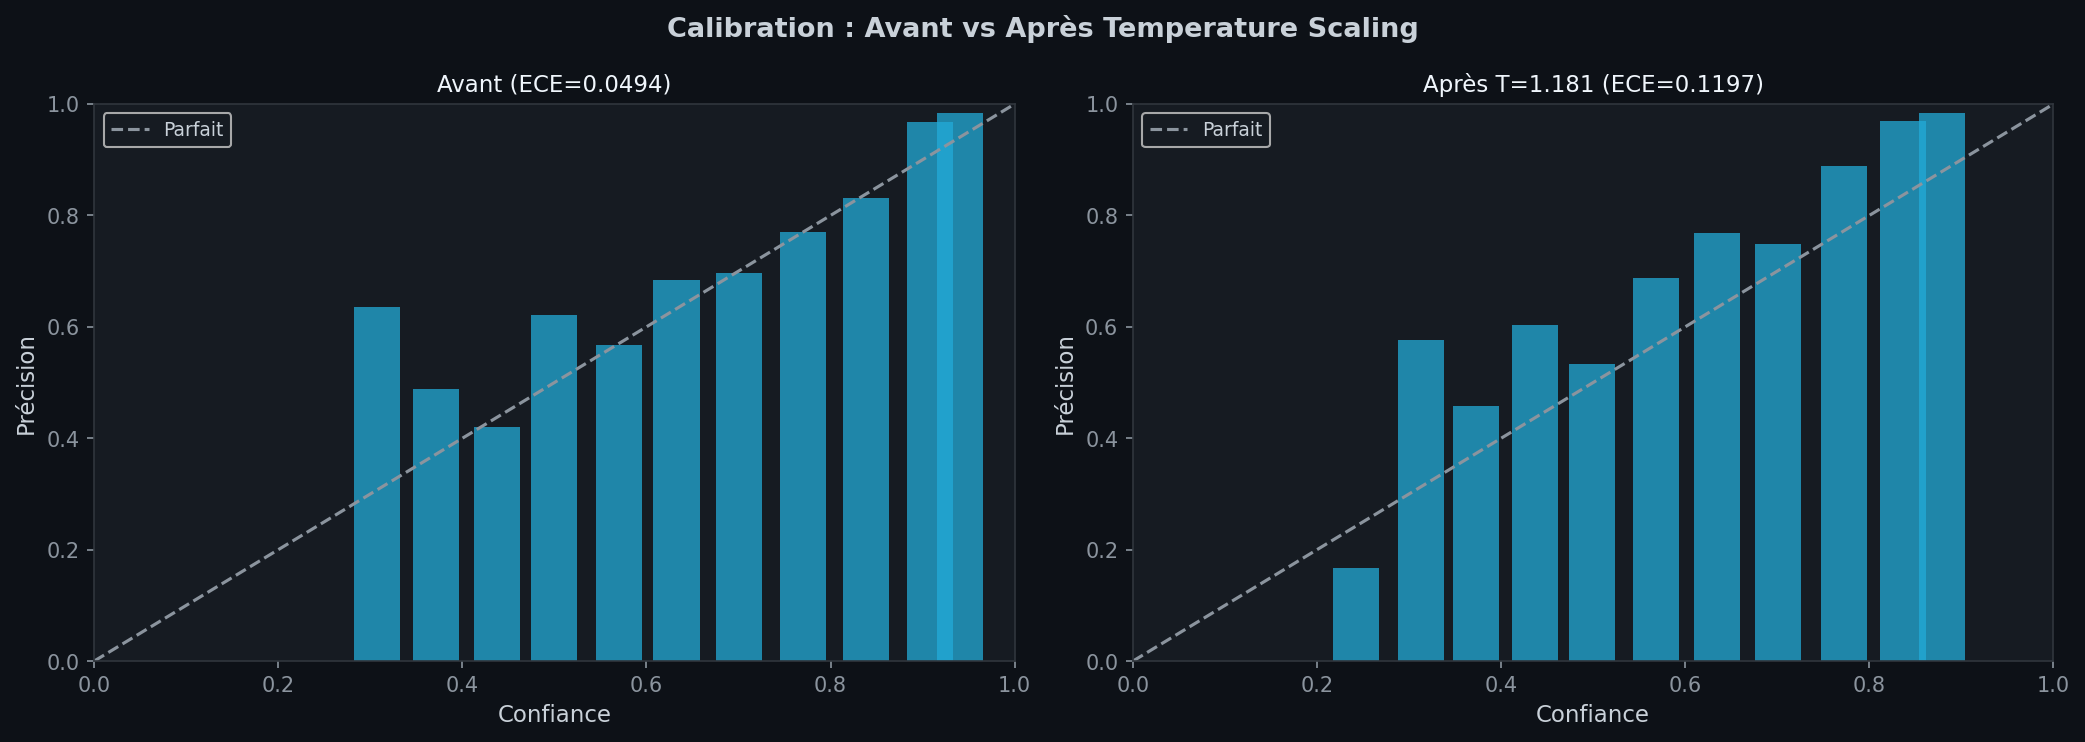
A single temperature is fitted on validation logits (T* = 1.181) by minimising cross-entropy, and applied to the test probabilities.
| Expected calibration error (15 bins) | Before | After |
|---|---|---|
| Test, MC-averaged probabilities (retained) | 0.0494 | 0.1197 |
| Validation logits, single pass | 0.0307 | 0.0665 |
In both evaluations the ECE increases after scaling. A temperature above 1 softens the probabilities; a plausible reading is that a model trained with label smoothing 0.1 is already close to calibrated or under-confident, so softening moves it further away. Two further details of the experiment may contribute: T is fitted on single-pass logits but applied to MC-averaged probabilities, and ECE on about 2,660 samples in 15 bins is noisy. None of these explanations was tested (no reliability-diagram analysis per bin is recorded); the result is reported as found.
3 — Conformal prediction (guaranteed coverage)
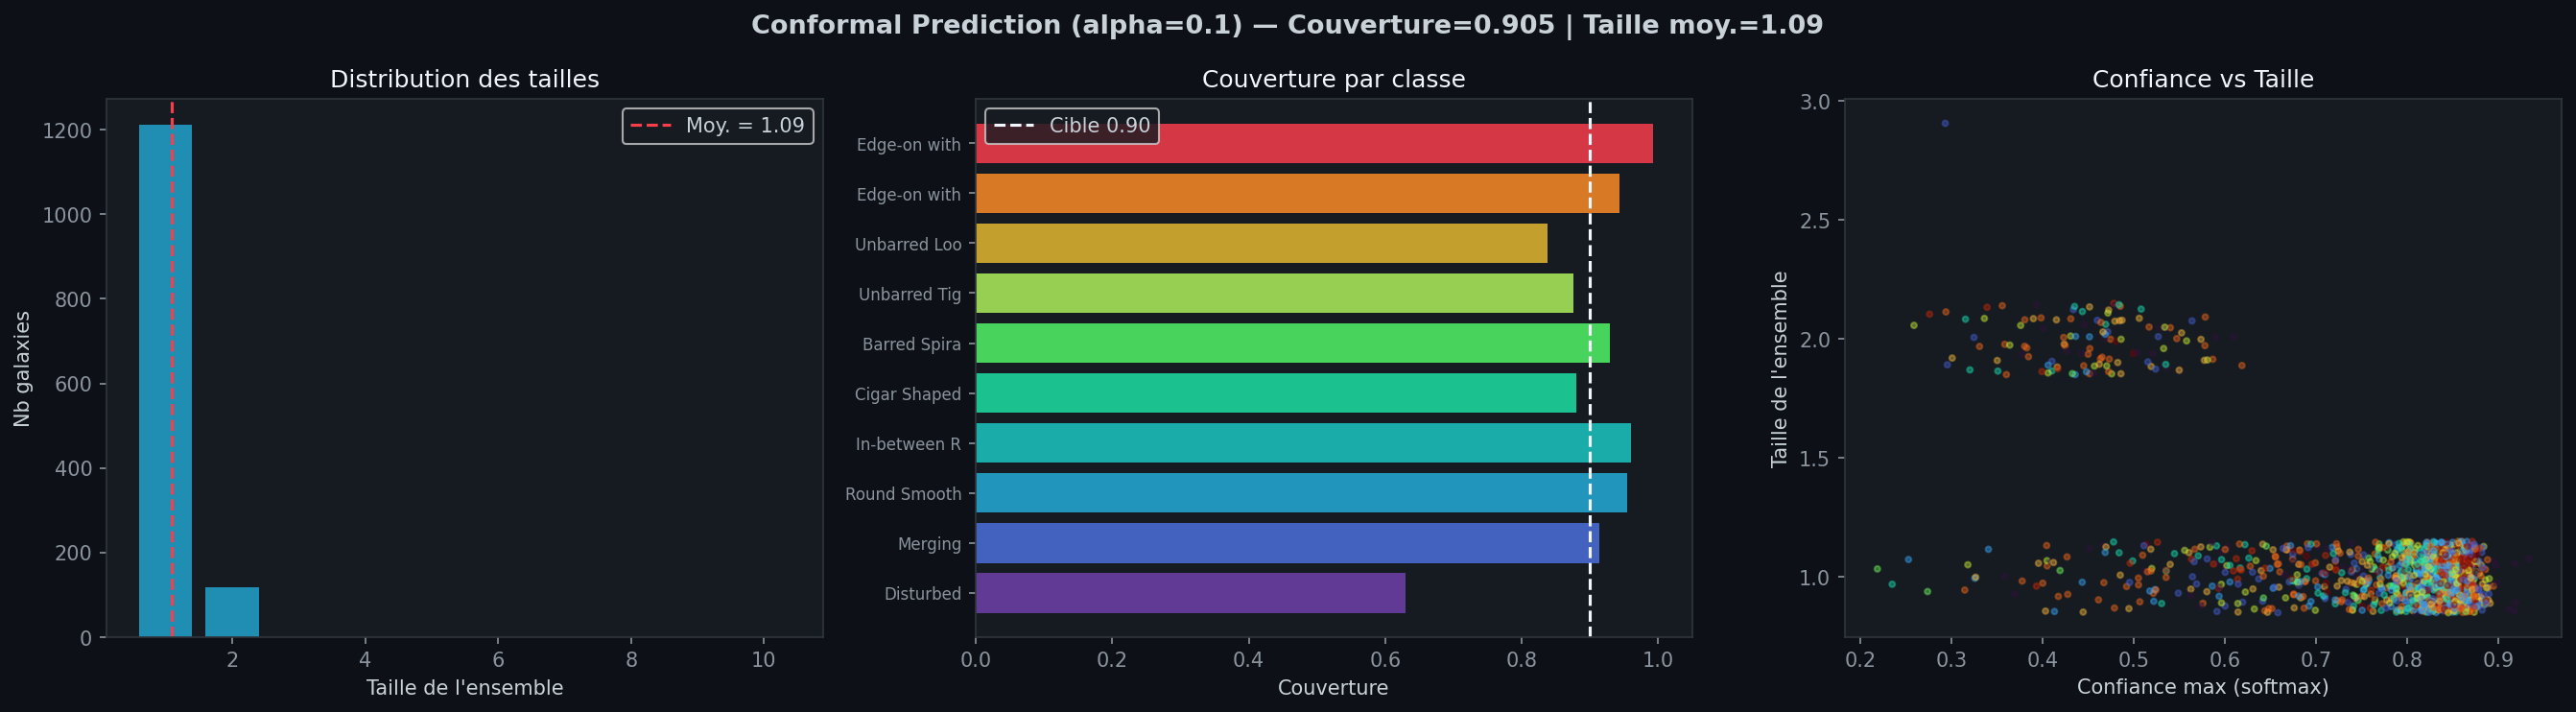
Split-conformal prediction with the least ambiguous score (1 − probability of the true class): the threshold q̂ = 0.763 is chosen on one half of the test set so that sets contain the true class with probability at least 1 − α = 0.10. The other half (1,331 galaxies) is used for evaluation.
| Prediction sets (α = 0.10) | Value |
|---|---|
| Empirical coverage | 0.9046 |
| Calibration-set coverage | 0.9008 |
| Mean set size | 1.09 |
| Sets with 1 class | 1212 |
| Sets with 2 classes | 118 |
| Sets with 3 classes | 1 |
Coverage (90.5%) meets the 90 % target, and almost all sets contain a single class (91.1%): the guarantee is cheap because the underlying classifier is accurate. The guarantee is marginal (averaged over galaxies), not per class: coverage within a hard class such as Disturbed is not controlled, and was not measured in the notebook.