Sensitivity & Reproducibility
This page asks whether the structures seen in the UMAP, t-SNE and HDBSCAN analyses depend on the hyper-parameters or on the random seed. It applies to the 183 spectroscopic features of the PHY-3500 · G1 · 43,019 spectra analysis set, reduced to 91 principal components before embedding. Only some parameters were swept; the page says which, and which were not.
PHY-3500 · G1 · 43,019 spectra — UMAP / t-SNE / HDBSCAN run phy3500_umap_tsne_run_20260405T214233Z (timings, seeds) and its summary phy3500_umap_tsne_run_20260430T215407Z (HDBSCAN). Nothing on this page comes from the G2 runs.
What was varied
| Method | Parameter | Values tested | Value retained | Fixed during the sweeps |
|---|---|---|---|---|
| UMAP | n_neighbors | 5, 15, 30, 50, 100 | 15 | min_dist = 0.1, metric, epochs |
| t-SNE | perplexity | 5, 15, 30, 50, 100 | 30 | PCA initialisation, 1,000 iterations |
| HDBSCAN | min_cluster_size | grid of five values (compute_sensitivity) | 75 | min_samples = 20, Euclidean, eom selection |
min_dist (UMAP) and min_samples (HDBSCAN) were not varied: the run reports contain embedding shapes only for n_neighbors and perplexity, and compute_sensitivity refits HDBSCAN for different min_cluster_size values at fixed min_samples. Statements about their influence would be untested.
UMAP and t-SNE hyper-parameters
For each value the full embedding was recomputed on the same input; the run report stores only the shape of each embedding, so the comparison is visual, from the sensitivity figures below. The verdicts in the table are qualitative readings of those figures, not computed scores.
Across the five n_neighbors panels, the overall layout — a large elongated structure and a more compact one — persists, while very small values break it into more fragments and very large values merge sub-structures. This is consistent with the usual trade-off of the parameter between local and global structure; it supports retaining a mid-range value but does not prove that value is optimal.
HDBSCAN: min_cluster_size
The number of clusters depends strongly on min_cluster_size: the sweep figure shows the cluster count falling steadily as the minimum size grows, while the noise fraction stays within a few percent and varies non-monotonically.
| Setting | Clusters | Noise points |
|---|---|---|
Fine analysis (min_cluster_size = 75) | 20 | 2,643 (6.14 %) |
| Presentation mode | 13 | 2,617 (6.08 %) |
The cluster count is a resolution choice, not a property of the data. The fine setting is used for physical interpretation of small groups; the presentation setting merges them for readability. Any cluster-based claim should state which setting it uses.
Seed stability (Procrustes)
Procrustes distance measures how much two embeddings differ after optimal translation, rotation and scaling; 0 means identical shape. Embeddings were recomputed with different random seeds and compared with the seed-0 reference (seed 0 is the reference itself and is excluded from the means).
init='pca' fixes an identical starting position. The KL penalty only penalises nearby neighbours — insensitive to the seed for large structures.t-SNE embeddings are far more reproducible across seeds than UMAP embeddings on this set. The t-SNE distances are one to two orders of magnitude below the UMAP ones for the same seeds (compare the bar heights above). A plausible contributor is the fixed PCA initialisation of t-SNE, but the runs do not isolate that effect, so this remains an interpretation. Either way, UMAP axes should not be compared quantitatively between runs; qualitative structure is what is reproducible.
Recommendations
| Question | Recommendation | Evidence |
|---|---|---|
Which n_neighbors / perplexity to use? | Mid-range values as retained above | Visual comparison only |
| Quoting a number of clusters? | Always give min_cluster_size and the mode | Cluster count depends on it |
| Comparing two UMAP runs? | Compare topology, not coordinates | Seed-to-seed Procrustes distances |
| Reproducing a run exactly? | Fix the seed (random_state = 42 by default in the loader and engines) and keep the PCA input identical | Code defaults |
Reference figures
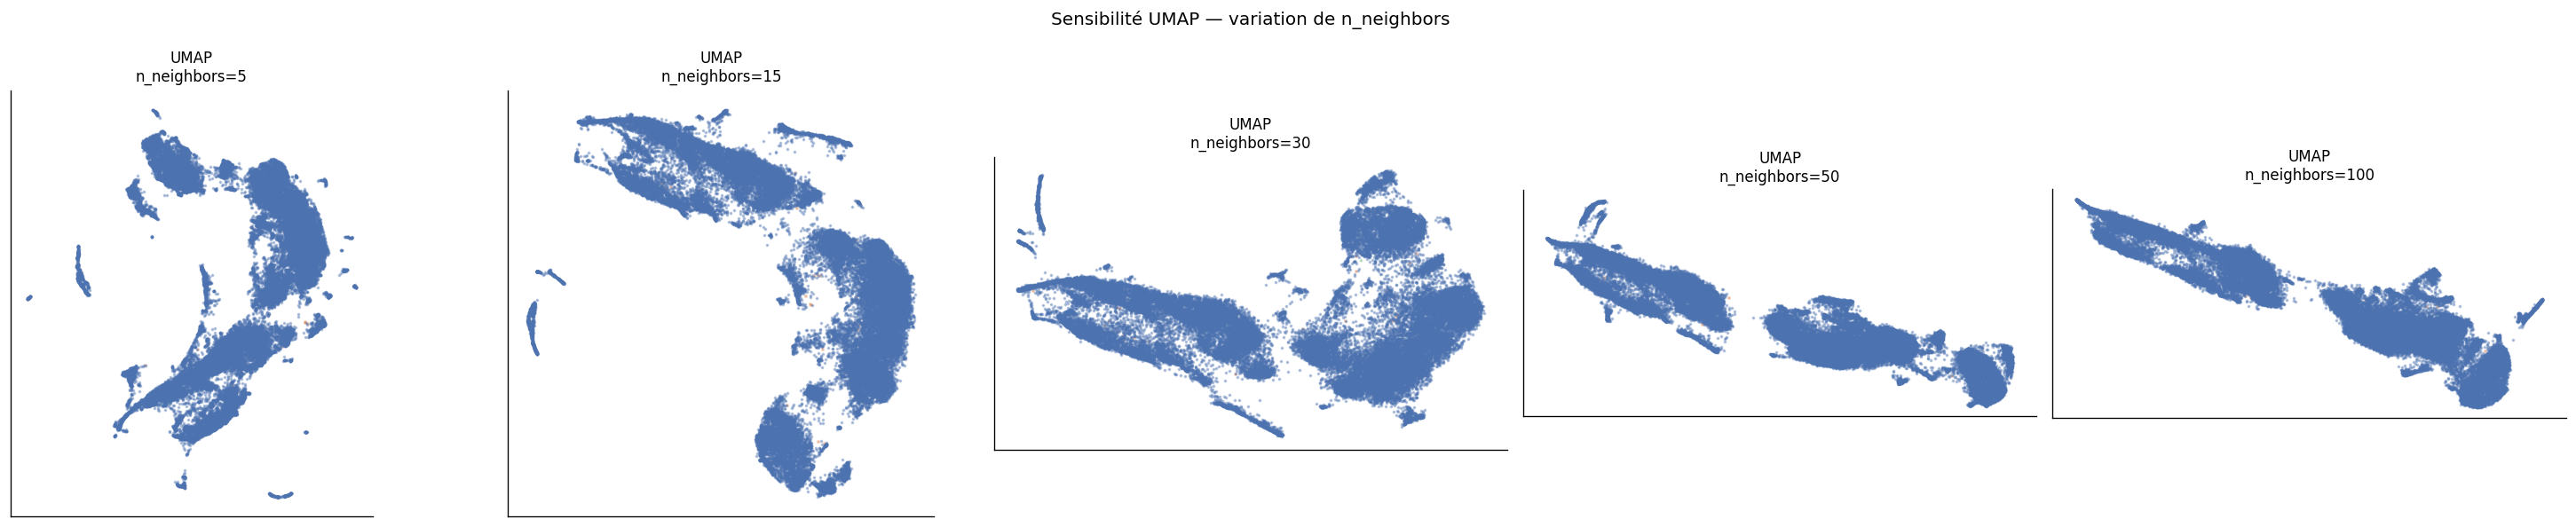
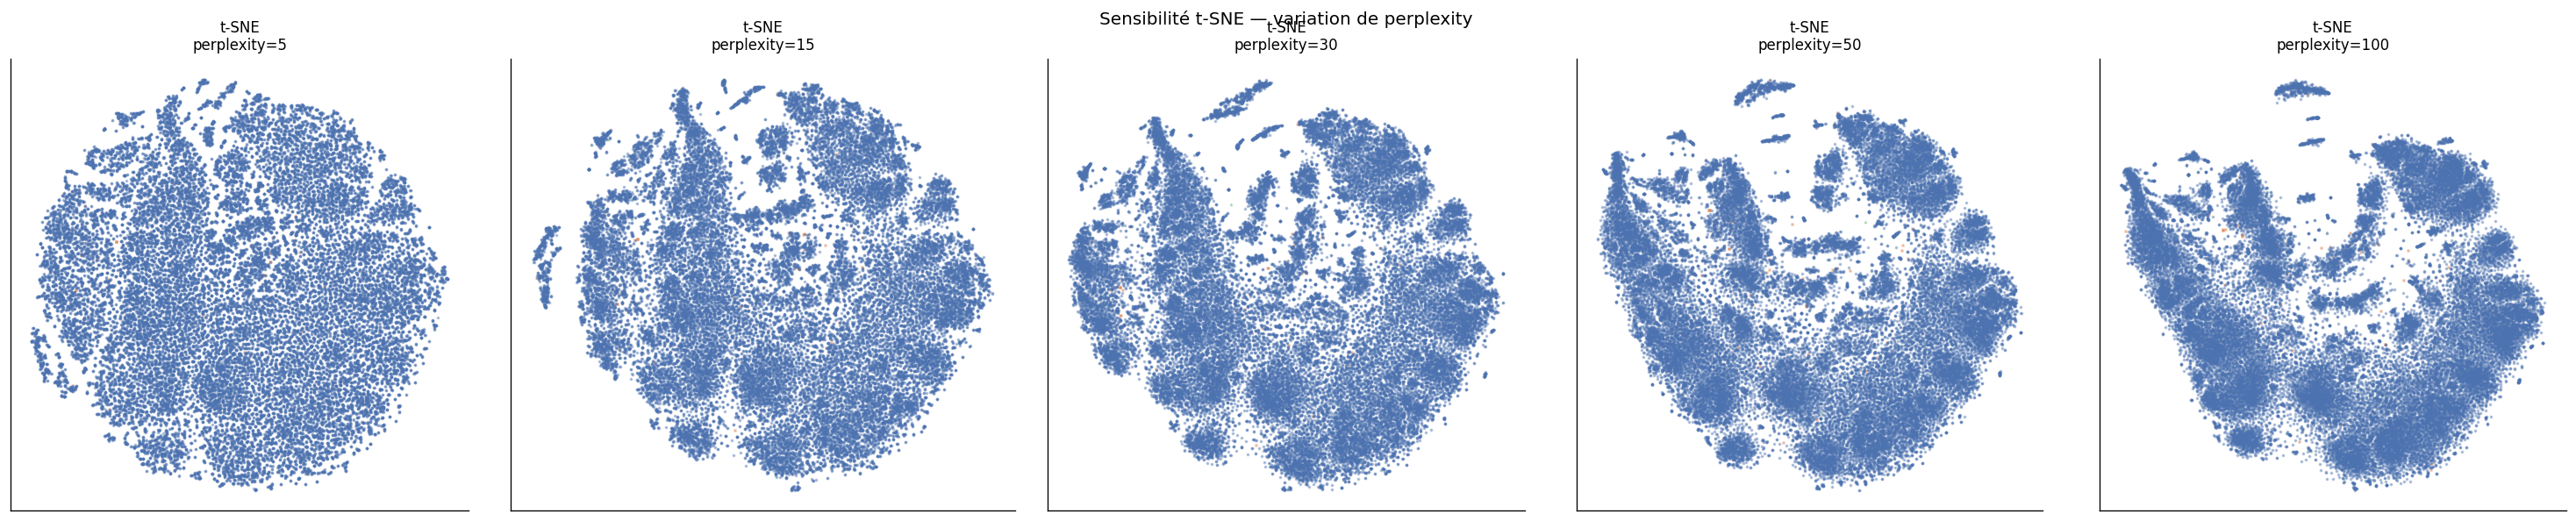
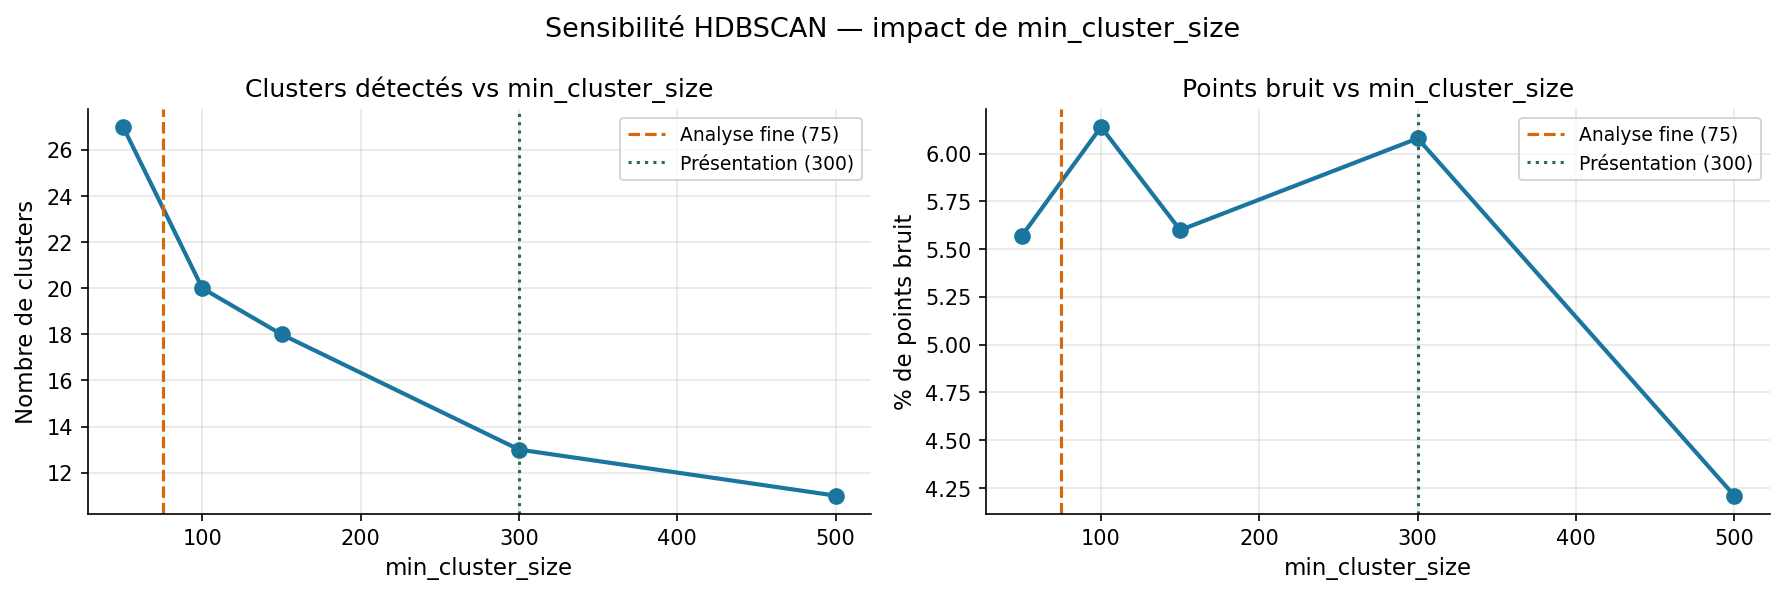
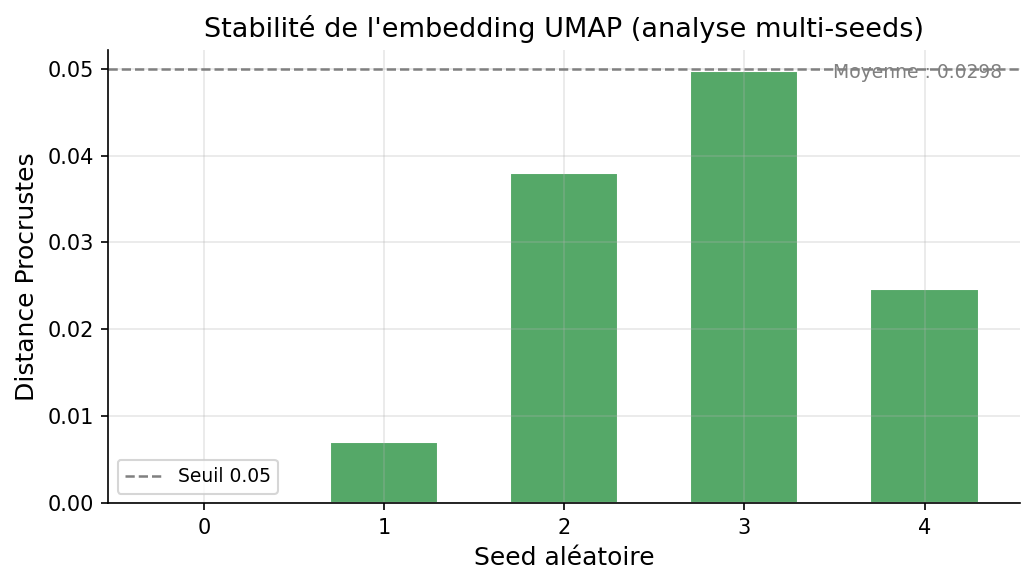
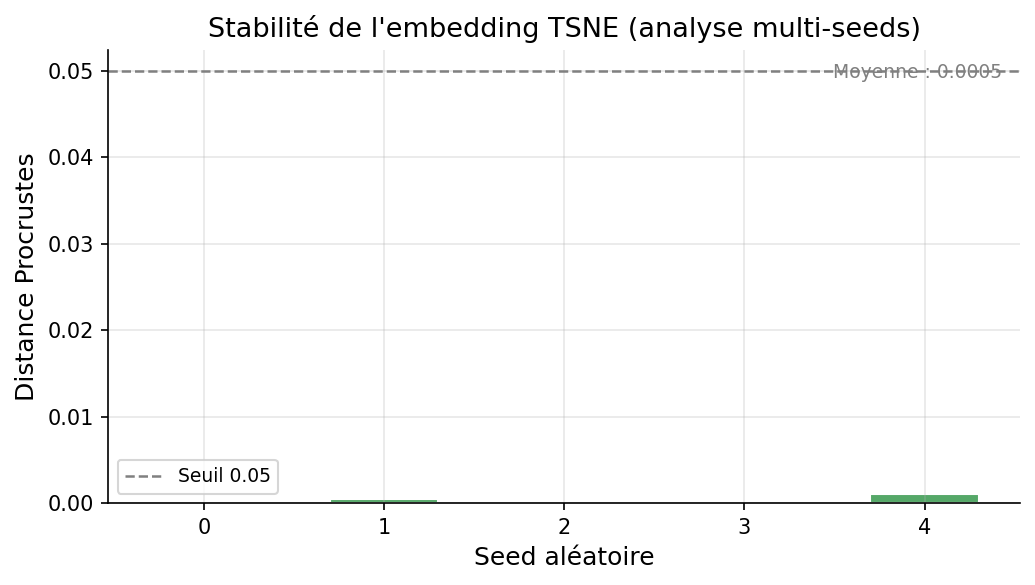
Figure titles in the images are in French (original notebook output).