t-SNE & Stability Analysis
PHY-3500 · G1 · 43,019 spectra — t-SNE and Procrustes results: run phy3500_umap_tsne_run_20260405T214233Z. Nothing on this page comes from the G2 runs.
t-SNE projection
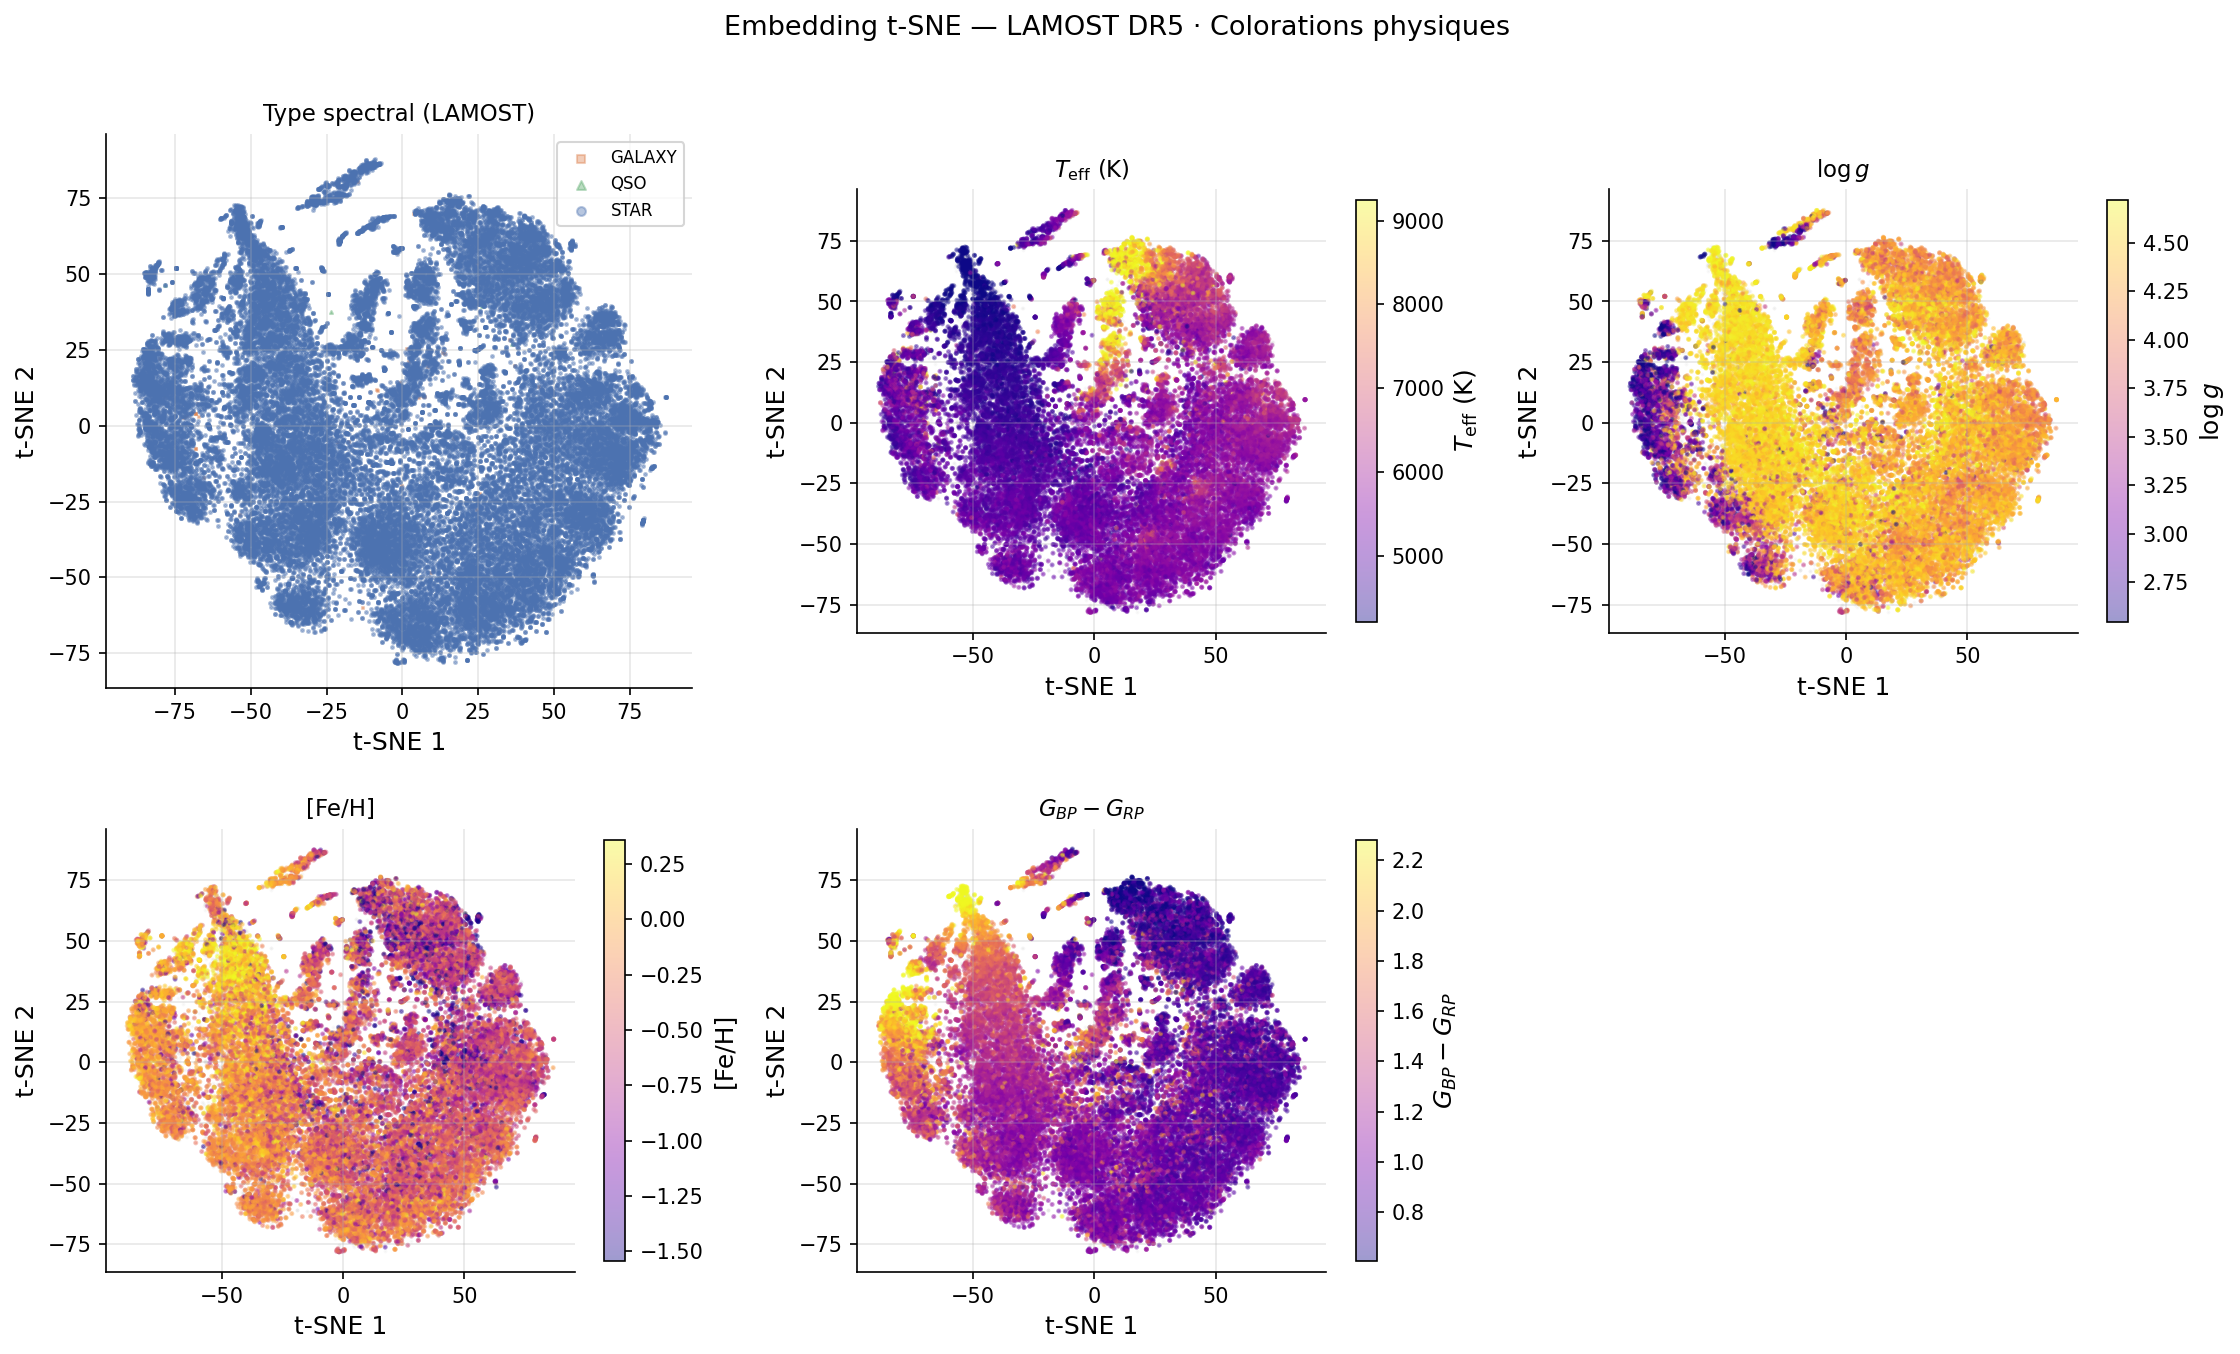
t-SNE is applied to the same 91 PCA components with perplexity=30, init='pca',
1,000 iterations (t = 80.2 s — approximately 2× UMAP). The projection produces an
"archipelago" of compact, separated masses, as opposed to UMAP's continuous continent.
Structural differences:
- Hot stars (A-F, T_eff > 7,000 K) form a distinct isolated cluster
- The central mass groups G-K main-sequence stars
- Log g colouring reveals partially isolated subgiant clusters
Complementarity with UMAP:
- t-SNE excels at sharp separation of discrete sub-populations
- UMAP better preserves continuous gradients (T_eff, [Fe/H])
 |
|---|
| t-SNE projection coloured by spectral type, T_eff, log g, [Fe/H] |
Procrustes stability analysis
Counter-intuitive result: t-SNE is 60× more stable than UMAP
Both methods use stochastic gradient descent (SGD), making this result surprising.
| Method | Initialisation | Mean Procrustes distance dP | Relative stability |
|---|---|---|---|
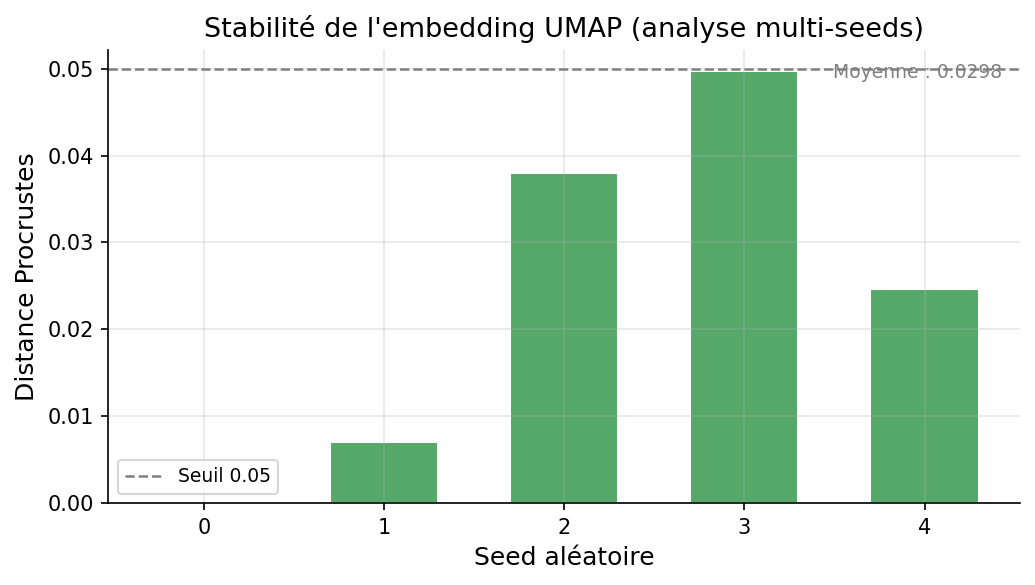
| UMAP | Spectral (Laplacian) | 3.0 × 10⁻² | Baseline |
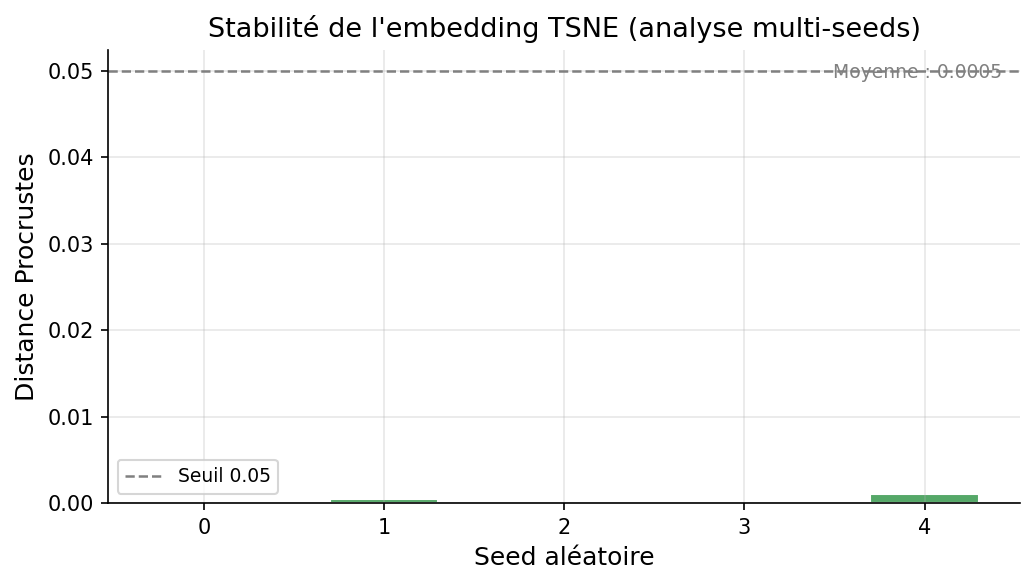
| t-SNE | init='pca' | 5.0 × 10⁻⁴ | 60× more stable |
Why UMAP is less stable:
- Spectral initialisation varies between seeds
- SGD with negative sampling introduces strong stochasticity in repulsive forces
Why t-SNE is more stable:
init='pca'fixes an identical starting position across seeds- KL penalty only penalises close neighbours — less sensitive to distant structure
 |  |
|---|---|
| UMAP: dP ~ 0.030 — significant run-to-run variability | t-SNE: dP ~ 5×10⁻⁴ — 60× more stable |
Perplexity sensitivity
The t-SNE projection is robust to perplexity in the range [15, 50]. Below perplexity = 15, cluster separation becomes artifactual. Above perplexity = 50, local structure blurs toward a UMAP-like gradient.
Recommended setting: perplexity=30 — optimal for N ≈ 43,000 spectra.
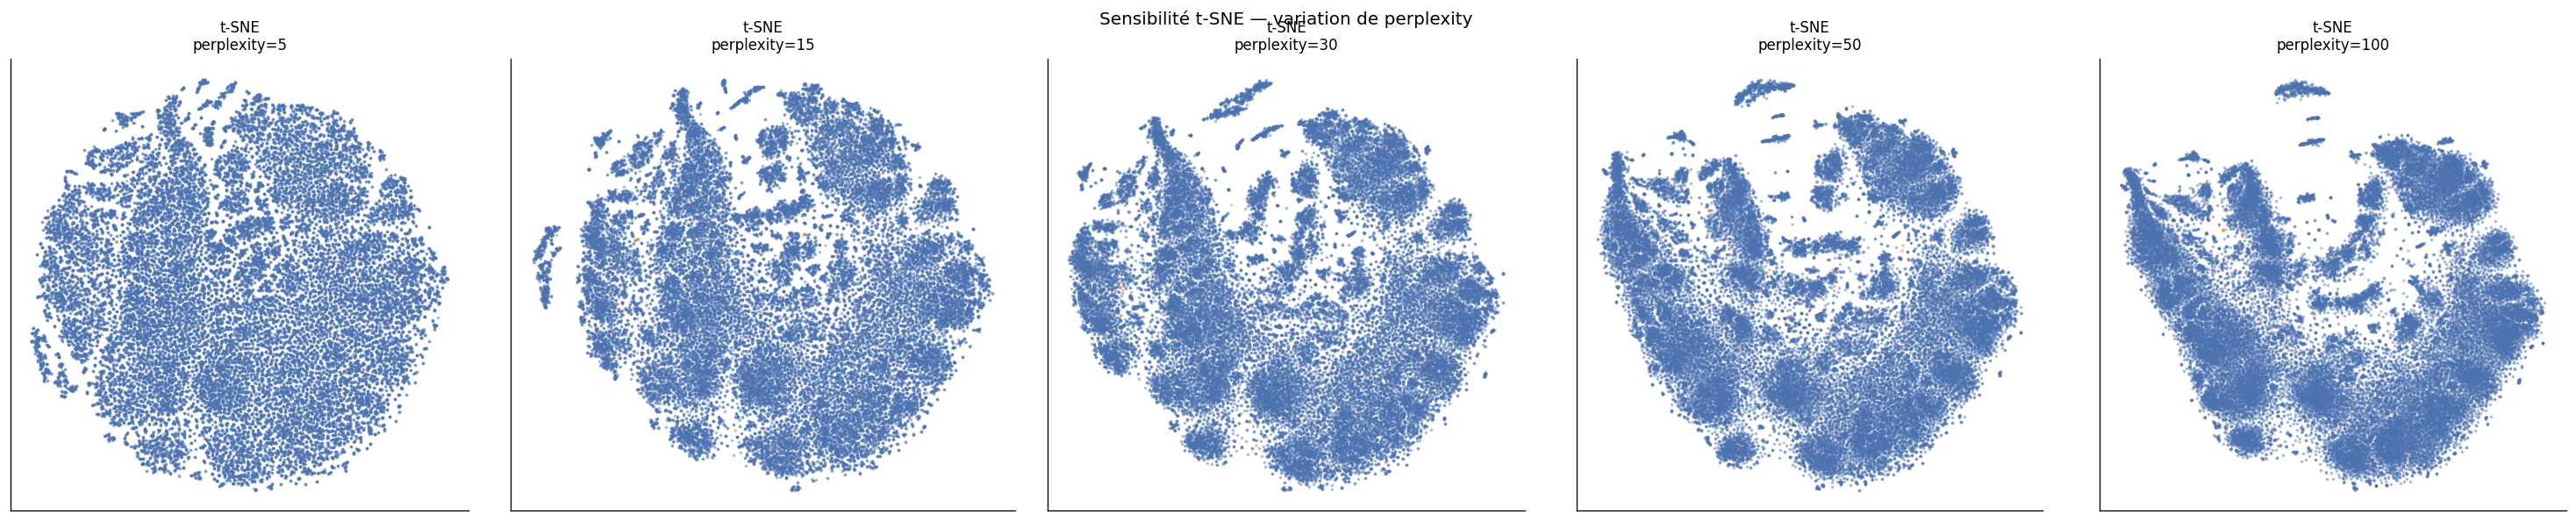
t-SNE robustness across perplexity ∈ [15, 50]
HR diagram coloured by t-SNE axis 1
ρ(t-SNE axis 1, T_eff) = +0.623 — intermediate between PCA (0.831) and UMAP (0.464). The thermal gradient is visible on the HR diagram but with more local structure than PCA.
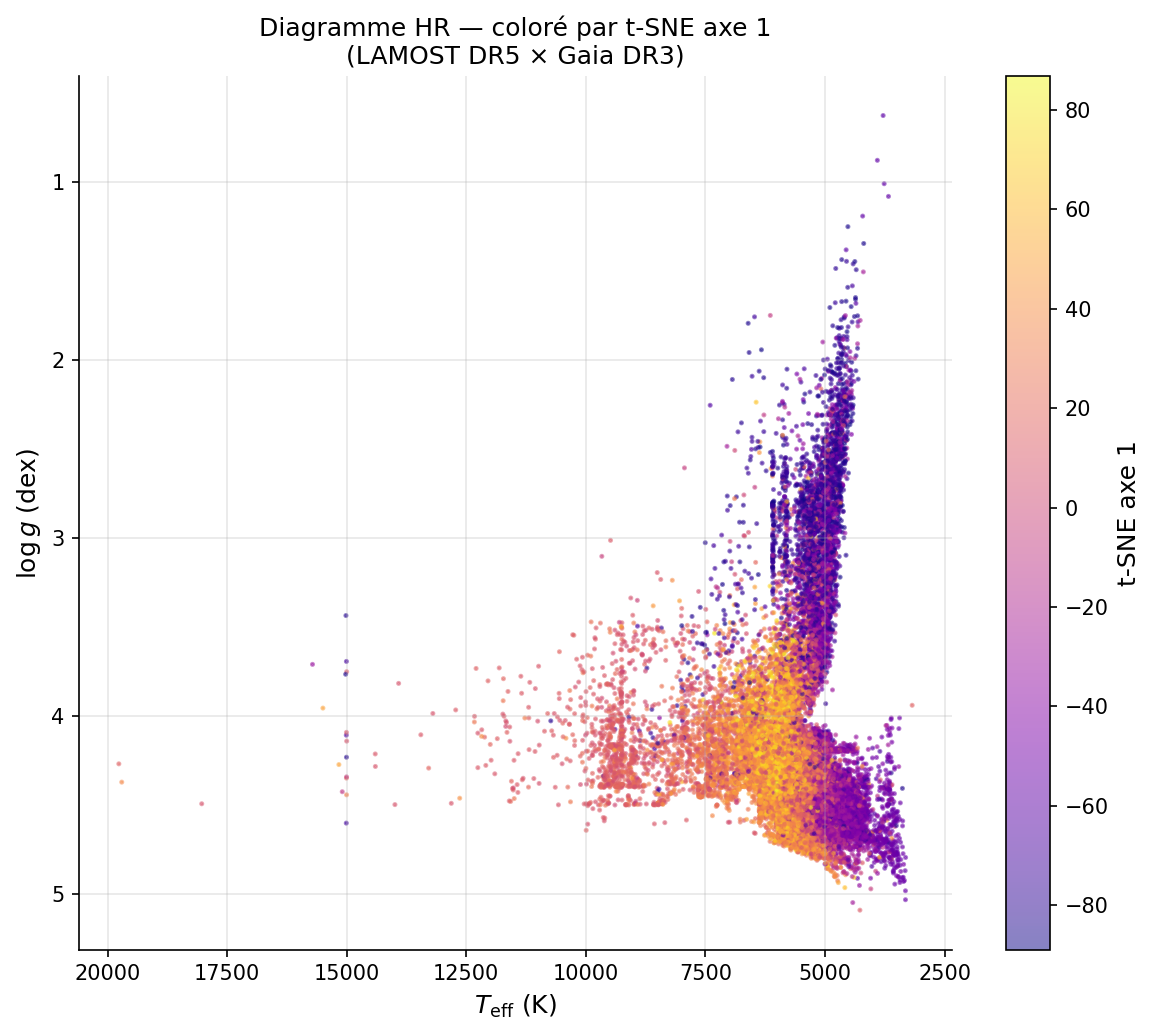
HR diagram coloured by t-SNE axis 1 — thermal correlation in t-SNE space
UMAP vs t-SNE side-by-side
 | |
|---|---|
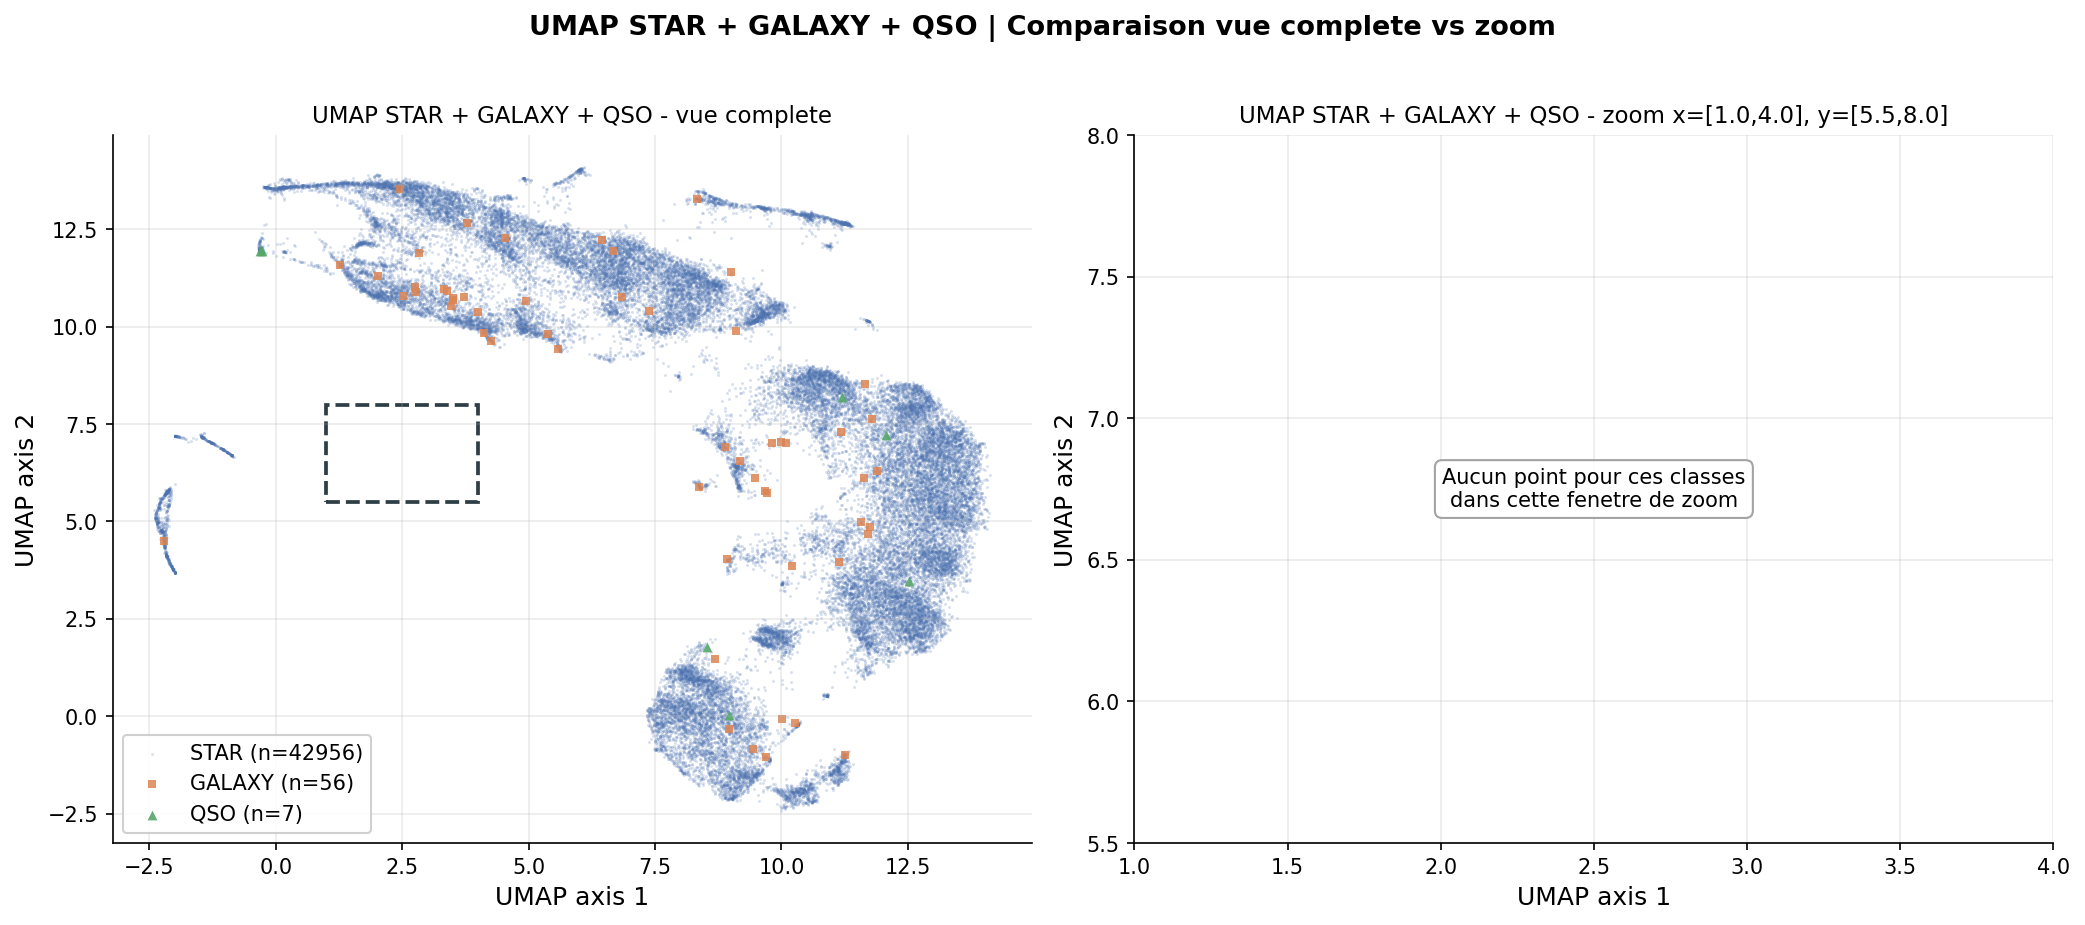
| Continuous continent (UMAP) vs compact archipelago (t-SNE) |