UMAP & HDBSCAN Clustering
PHY-3500 · G1 · 43,019 spectra — UMAP / HDBSCAN results: run phy3500_umap_tsne_run_20260405T214233Z (timings, seeds) and its summary phy3500_umap_tsne_run_20260430T215407Z (HDBSCAN). Nothing on this page comes from the G2 runs.
UMAP projection
UMAP is applied to the first 91 PCA components (95 % variance threshold) with:
n_neighbors=15, min_dist=0.1, 200 epochs (t = 40.1 s on Ryzen 9 5950X).
The projection reveals a "continuous continent" structure where the Harvard spectral sequence (M → K → G → F → A) unfolds without supervision along the main axis.
Correlations:
- ρ(UMAP axis 1, T_eff) = +0.464 — thermal gradient along first axis
- The luminosity class (dwarfs vs giants) induces a visible topological bifurcation when coloured by log g
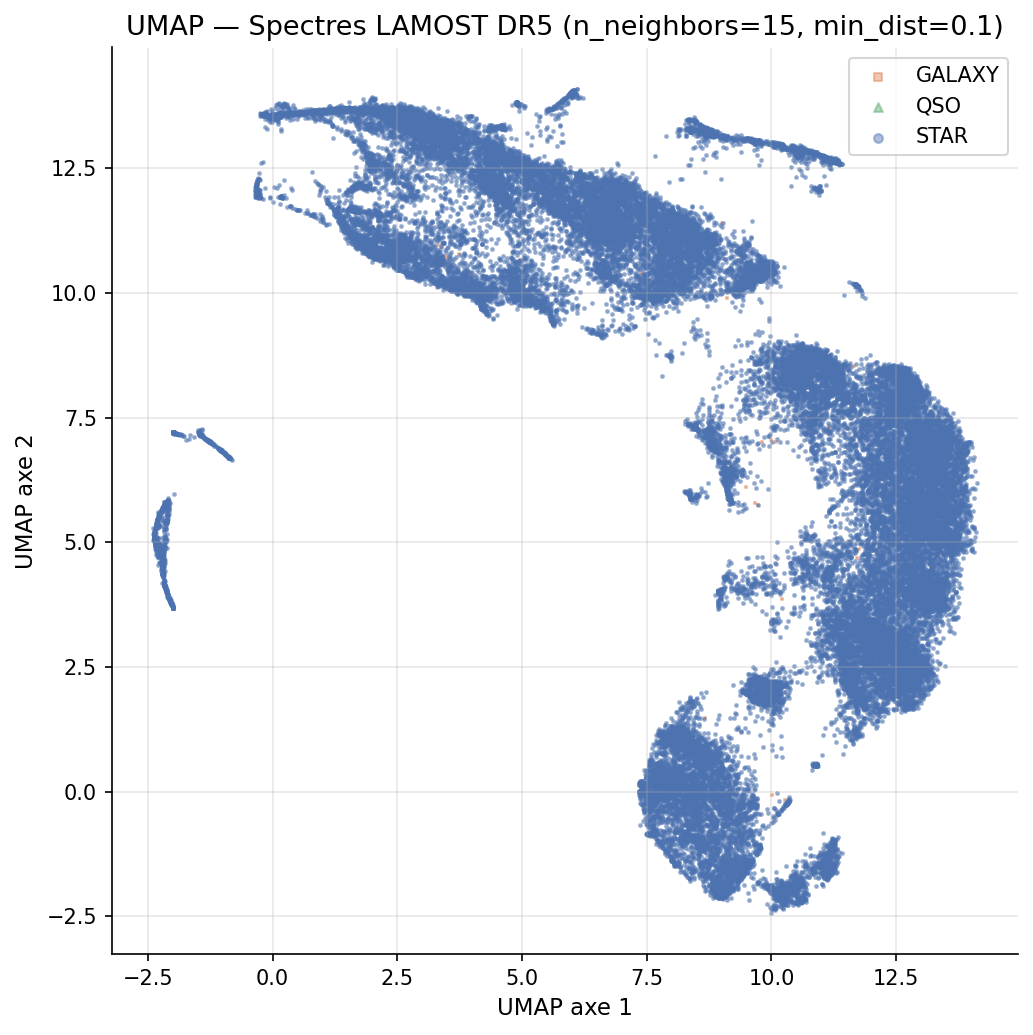
UMAP projection coloured by LAMOST spectral type — Harvard sequence emerges without supervision
Negative control
UMAP applied to data with randomly permuted columns → compact homogeneous cloud with no structure. The observed structure is of physical origin, not an algorithmic artefact.
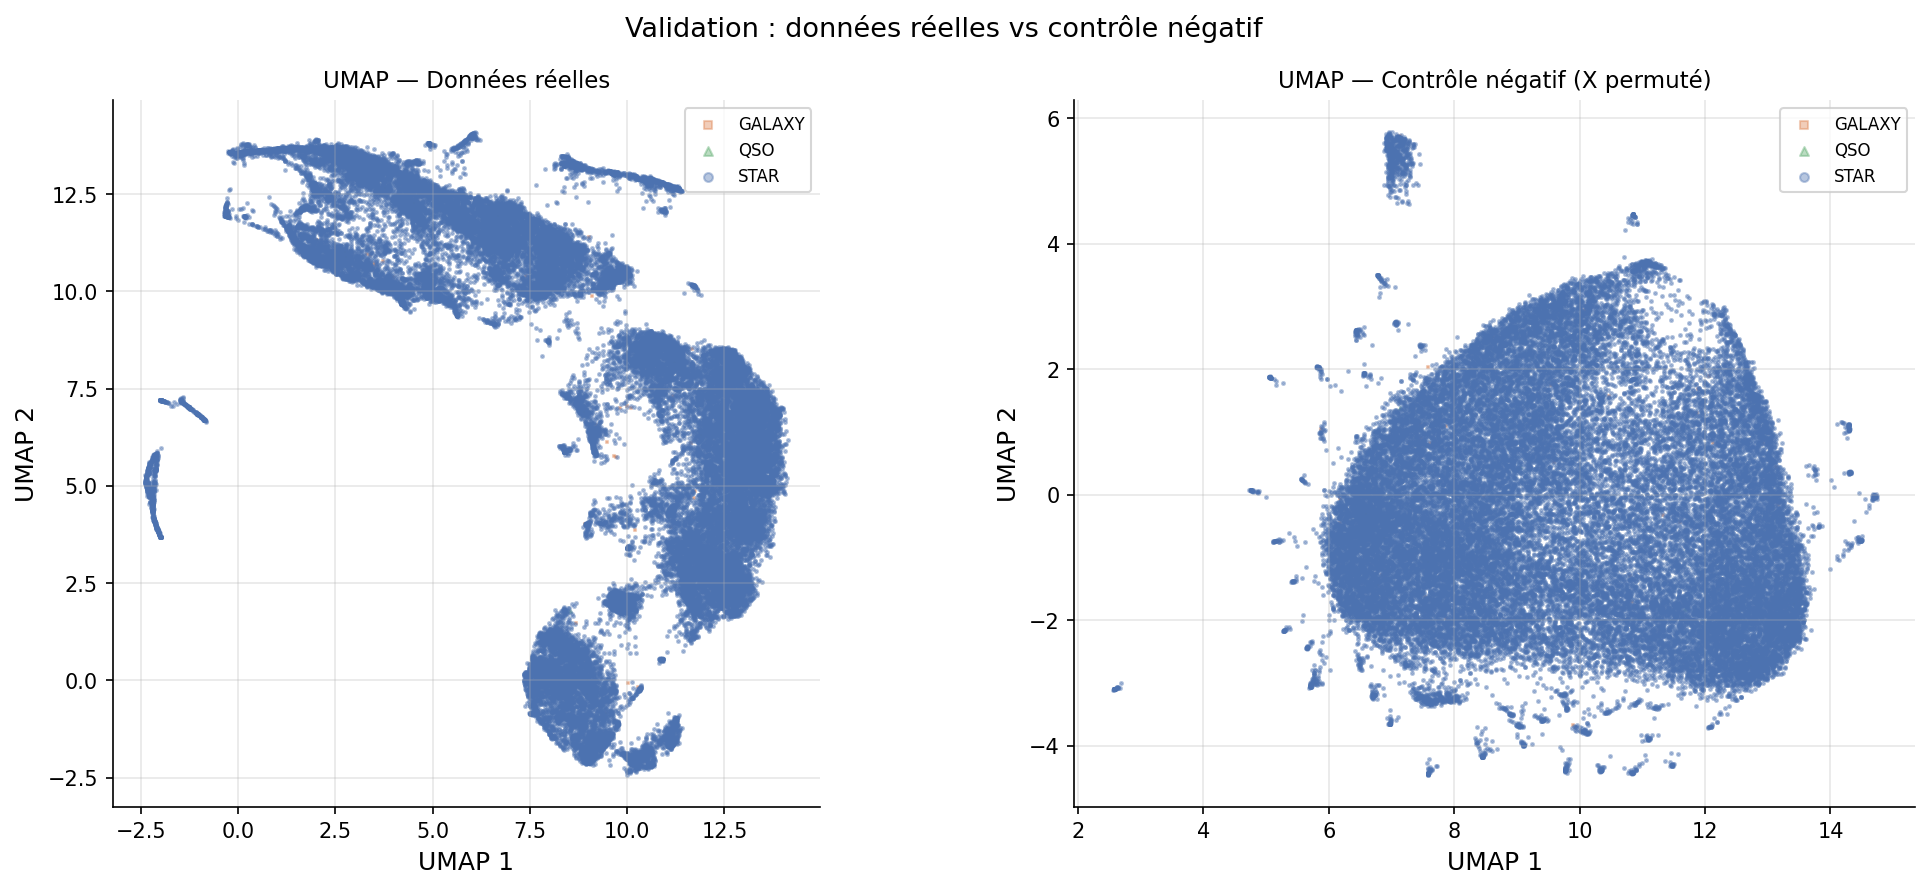
Permuted features → no structure. Physical origin confirmed.
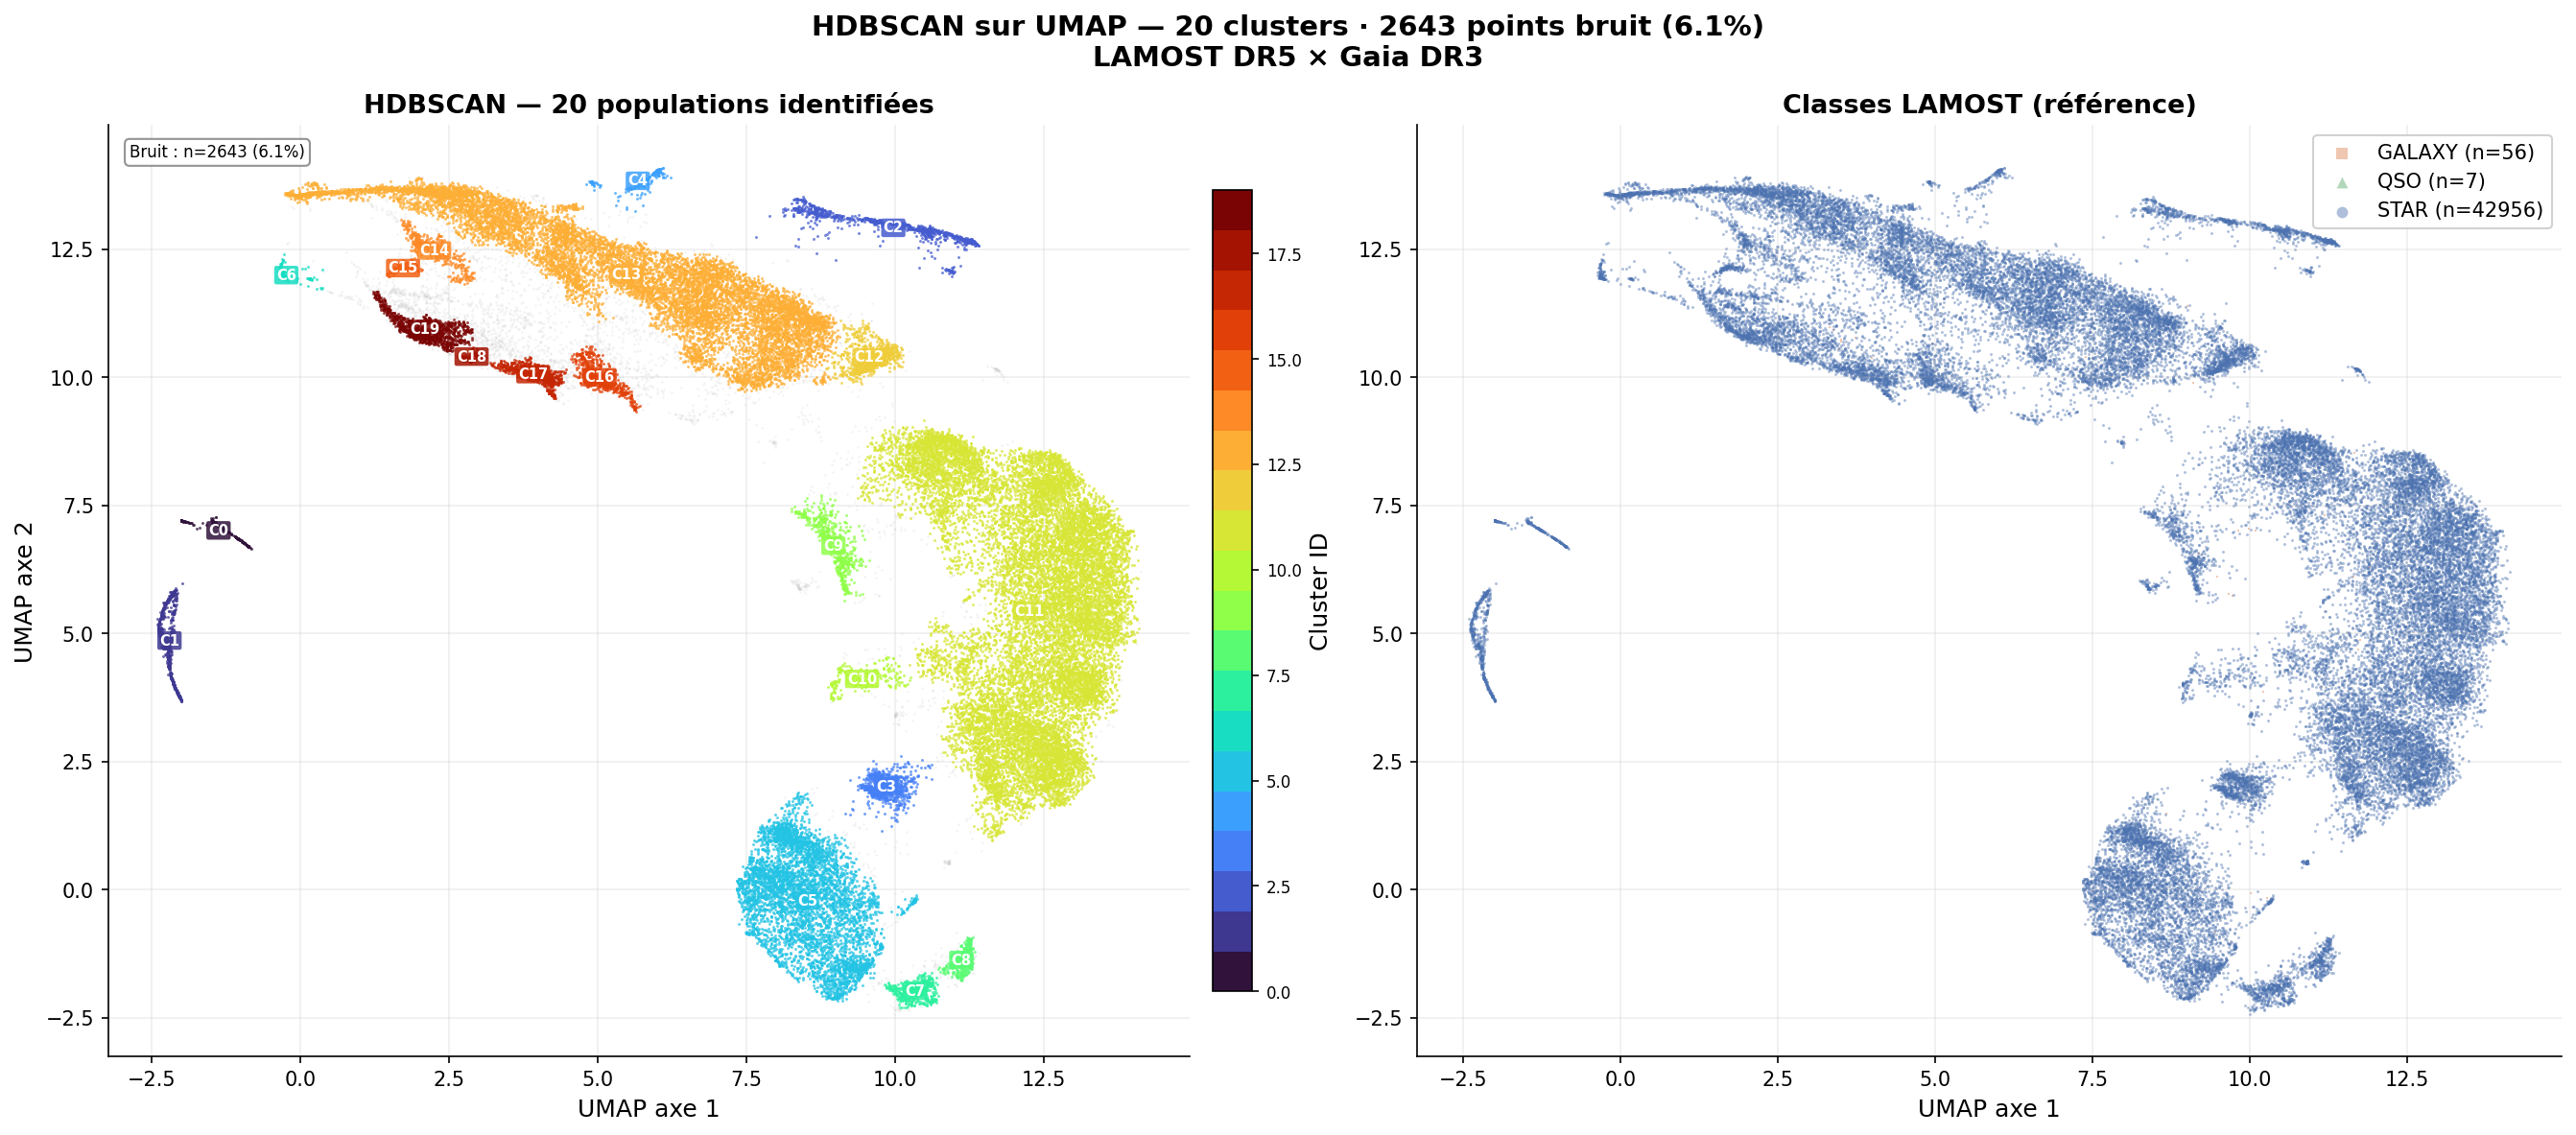
HDBSCAN clustering — 20 groups without any label
HDBSCAN (Hierarchical Density-Based Spatial Clustering of Applications with Noise)
is applied to the UMAP embedding with min_cluster_size=75, min_samples=20.
Summary statistics
| Value | |
|---|---|
| Total clusters | 20 |
| Noise points | 2,643 (6.14 %) |
| Largest cluster (C11) | 16,716 stars — G-K main sequence |
| Second cluster (C13) | 10,373 stars — cool K dwarfs |
Top-12 cluster populations
| Cluster | N stars | Physical identification |
|---|---|---|
| C11 | 16,716 | G-K main sequence |
| C13 | 10,373 | Cool K dwarfs |
| C5 | 5,083 | — |
| C2 | 915 | Subgiants / base RGB |
| C19 | 900 | Subgiants / base RGB |
| C12 | 851 | Subgiants / base RGB |
| C1 | 654 | Subgiants / base RGB |
| C16 | 620 | — |
| C17 | 615 | — |
| C3 | 818 | — |
| C9 | 576 | — |
| C7 | 474 | — |
Physical identification on the HR diagram
| Clusters | T_eff | log g | Physical interpretation |
|---|---|---|---|
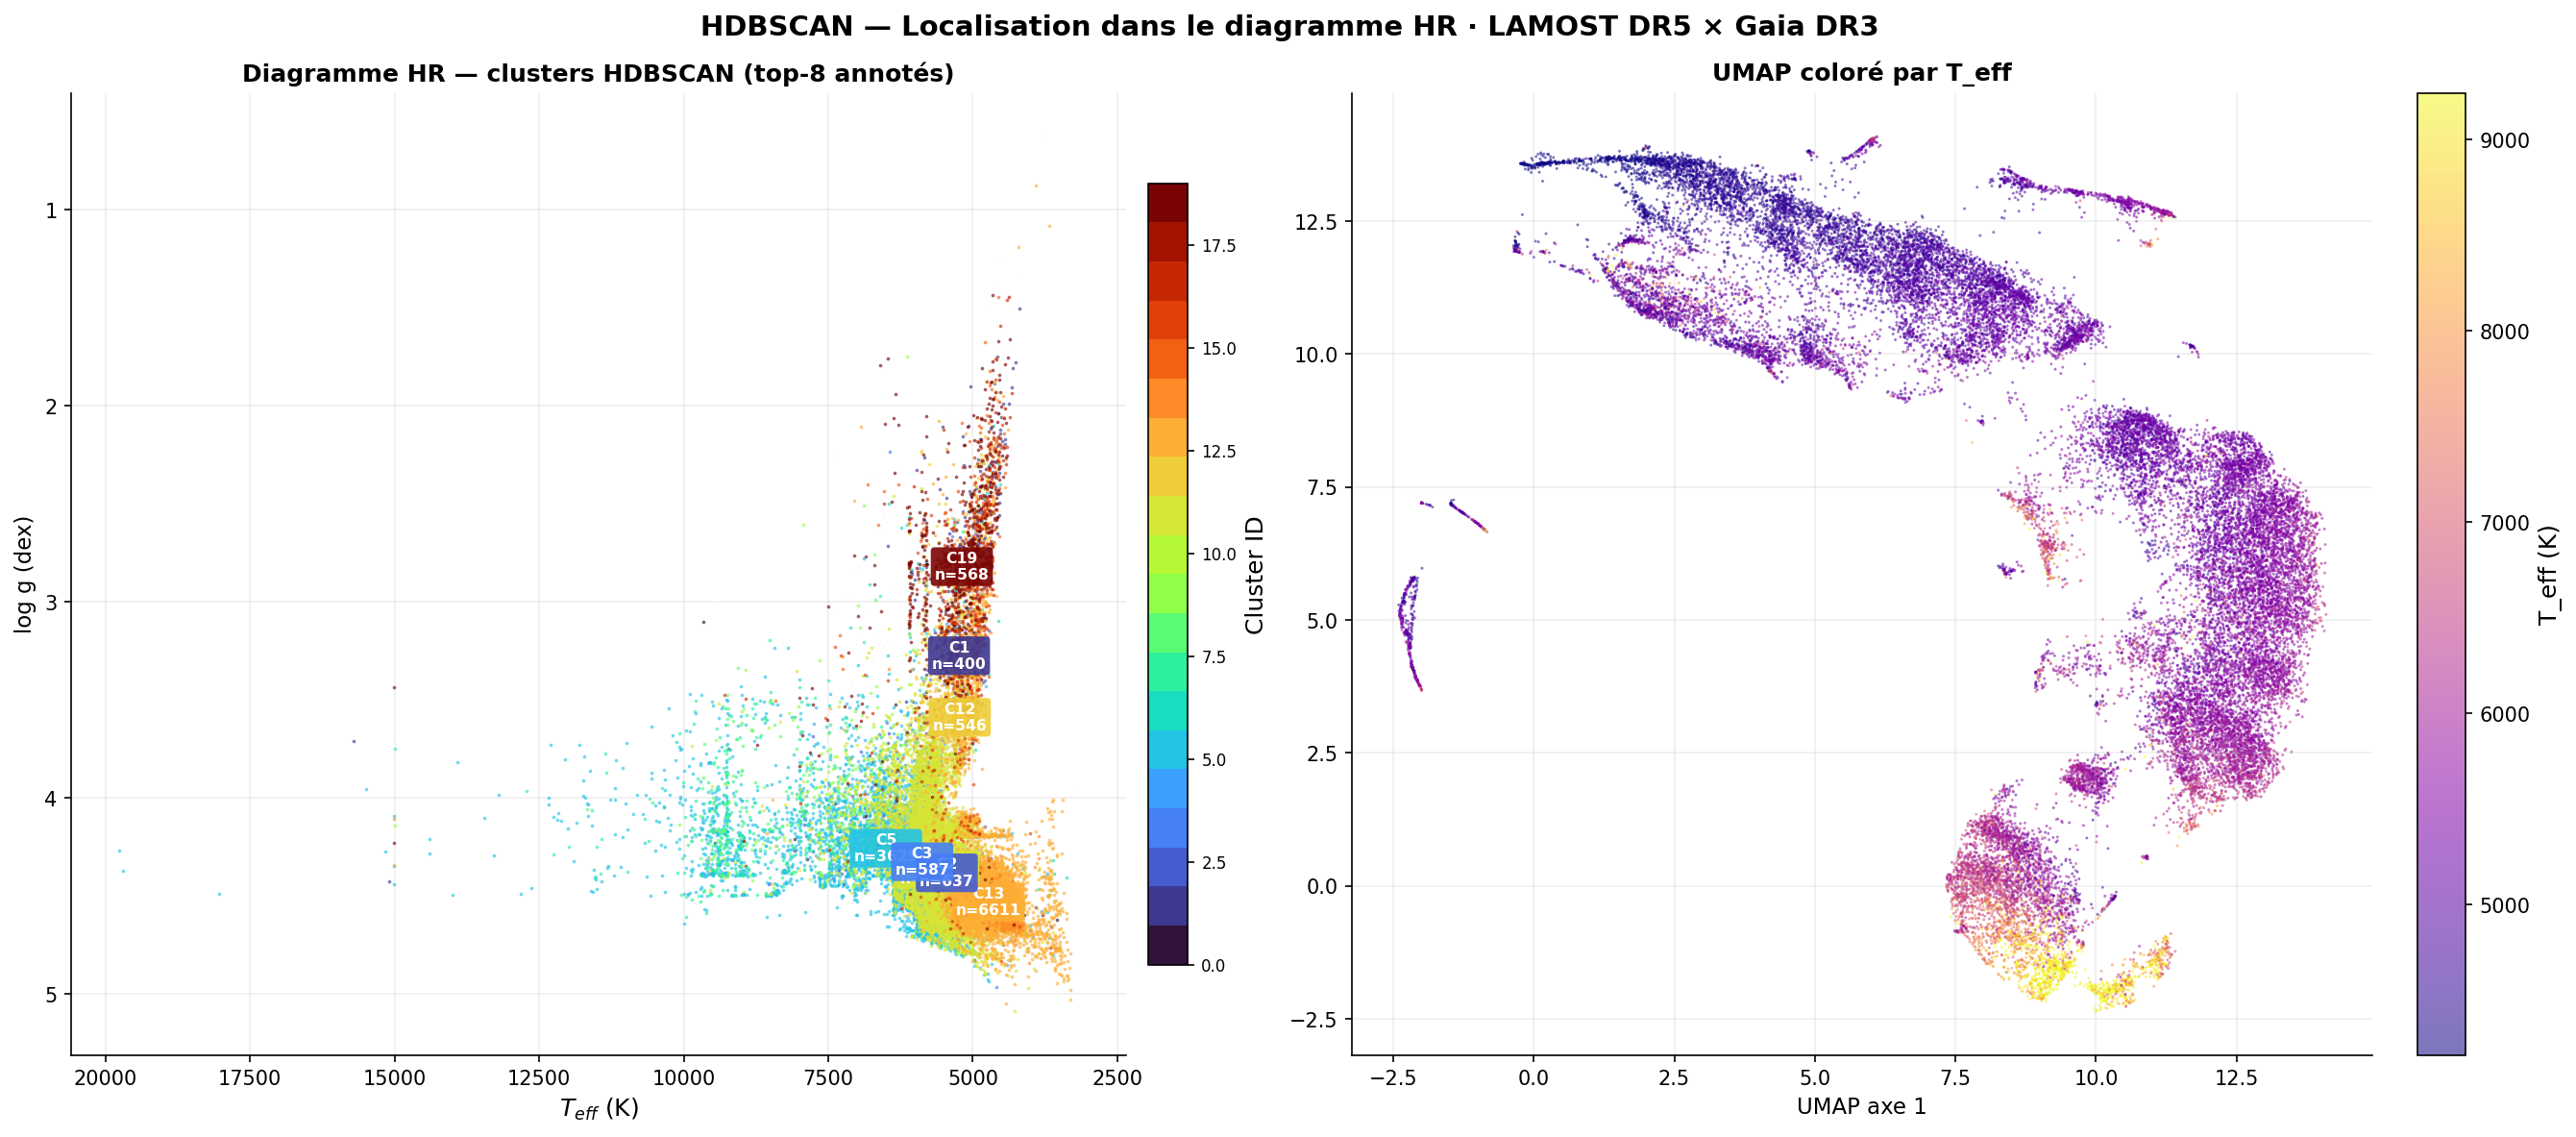
| C19, C1, C12 | 5000–5500 K | ≈ 3.0–3.5 | Subgiants / base RGB — strengthened Ca II, weakened Balmer → lower surface radiation pressure |
| C13 | 4500–5000 K | ≈ 4.5 | Cool K dwarfs — clearest physical identity |
| C11 | 5000–6000 K | ≈ 4.0–4.5 | G-K main sequence — dominant population |
Without any label or log g information, UMAP organises spectra such that HDBSCAN recovers the dwarf/subgiant distinction at fixed T_eff. Clusters C19, C1, and C12 are spectrally distinguished by strengthened Ca II lines and weakened Balmer lines — the signature of lower surface radiation pressure in giant atmospheres.
 |  |
|---|---|
| 20 HDBSCAN clusters · 6.14 % noise · C11 = 16,716 stars | Clusters on HR diagram: C19/C1/C12 = subgiants · C13 = K dwarfs |
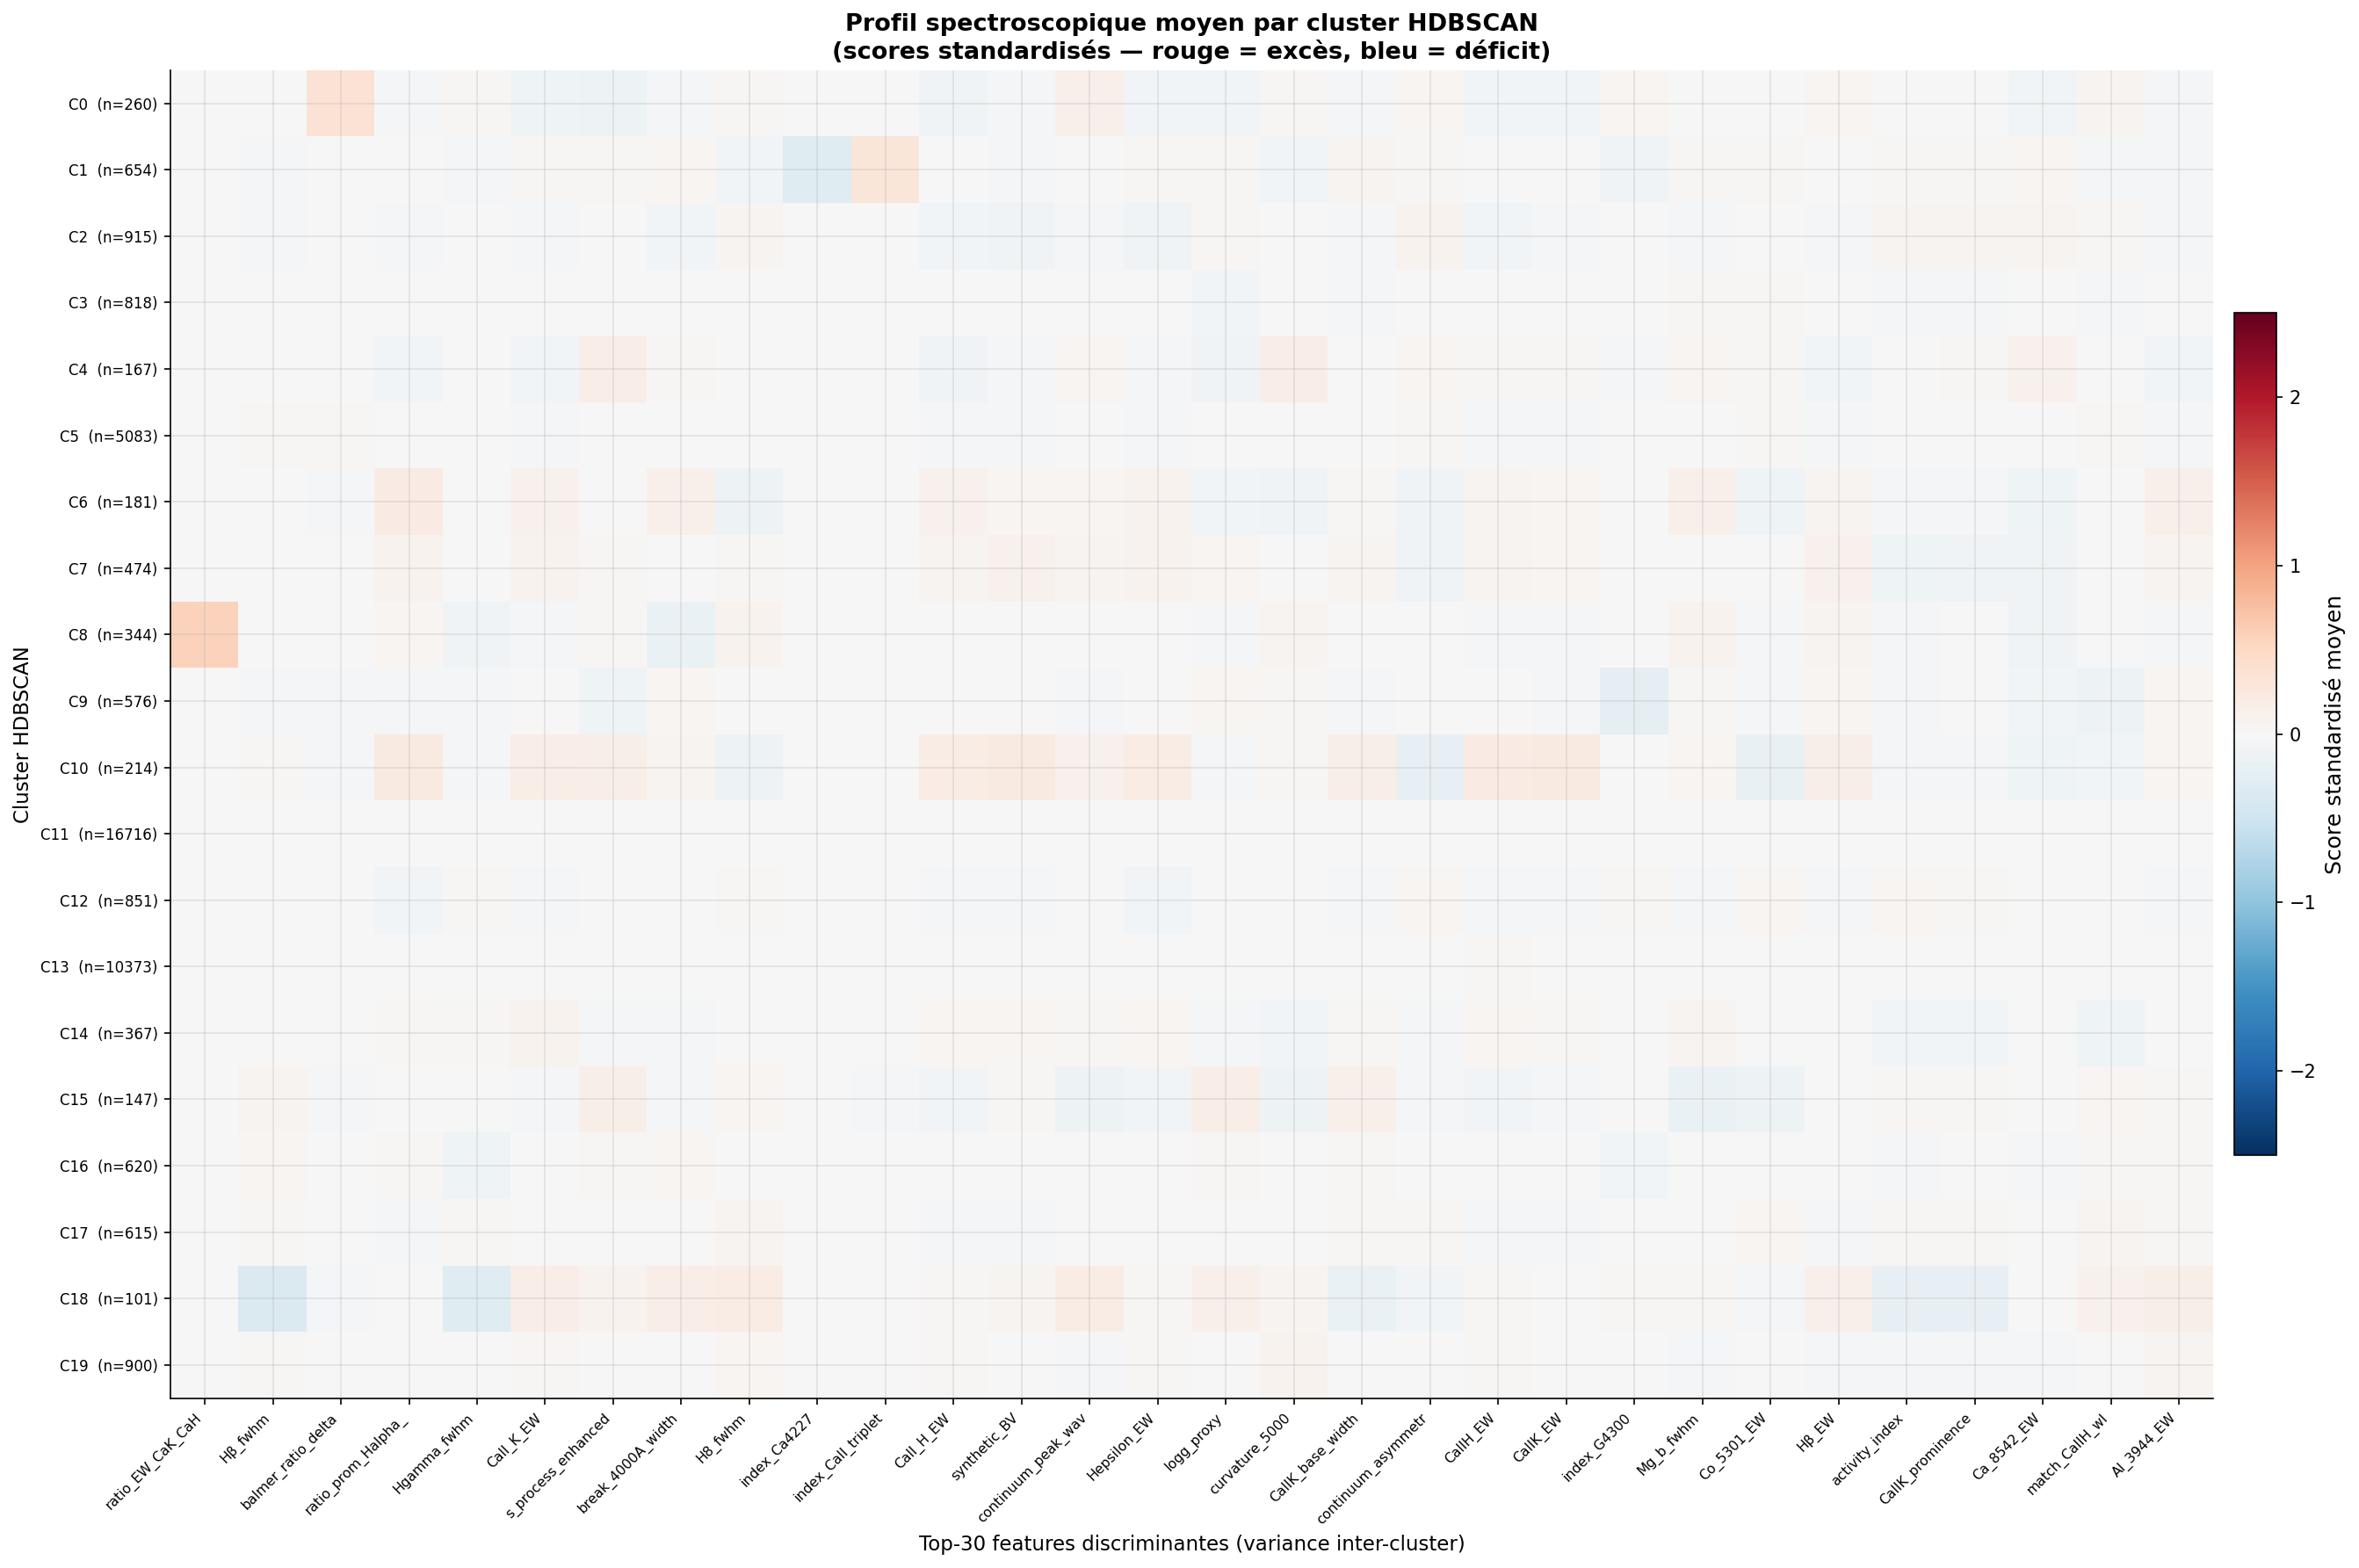 | 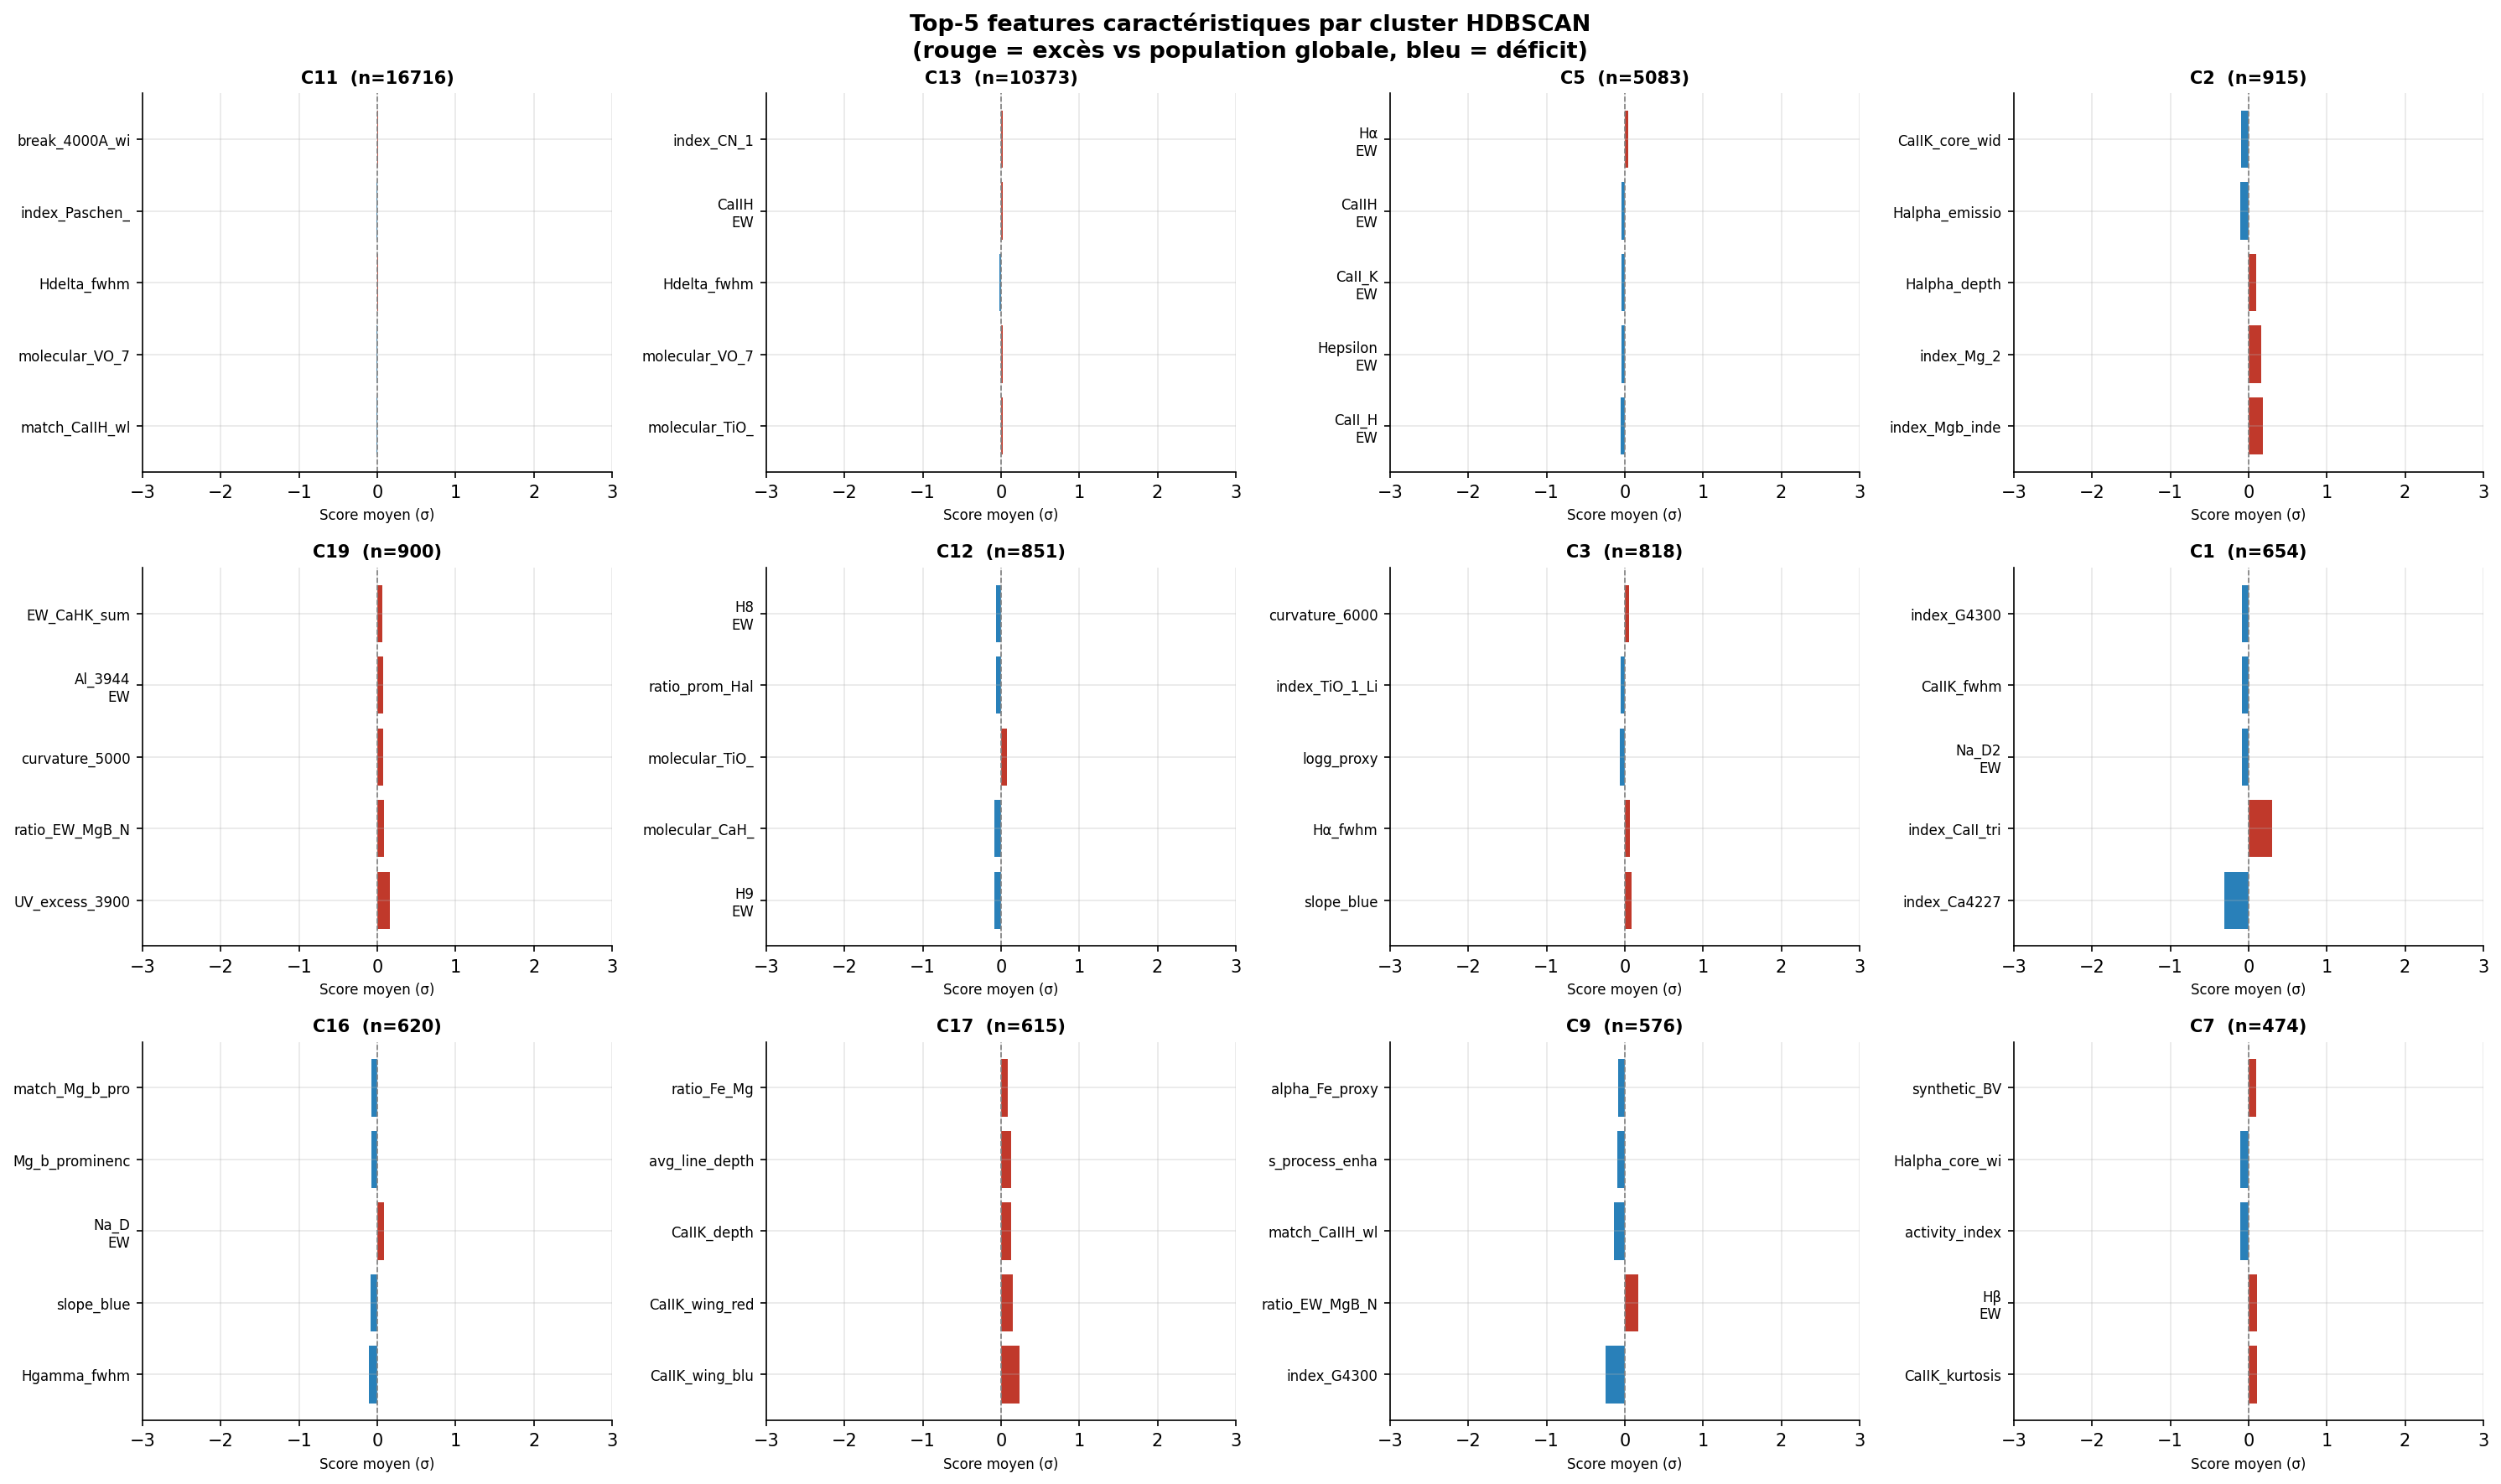 |
|---|---|
| SHAP-weighted feature heatmap by cluster | Spectral feature profiles for each cluster |
UMAP sensitivity analysis
Hyperparameter sensitivity was assessed over: n_neighbors ∈ 50,
min_dist ∈ 0.5.
Robust results:
- The Harvard-sequence gradient along axis 1 is stable across all tested parameters
- The dwarf/giant bifurcation appears consistently for
n_neighbors≥ 10 min_dist = 0.1offers the best balance between local and global structure
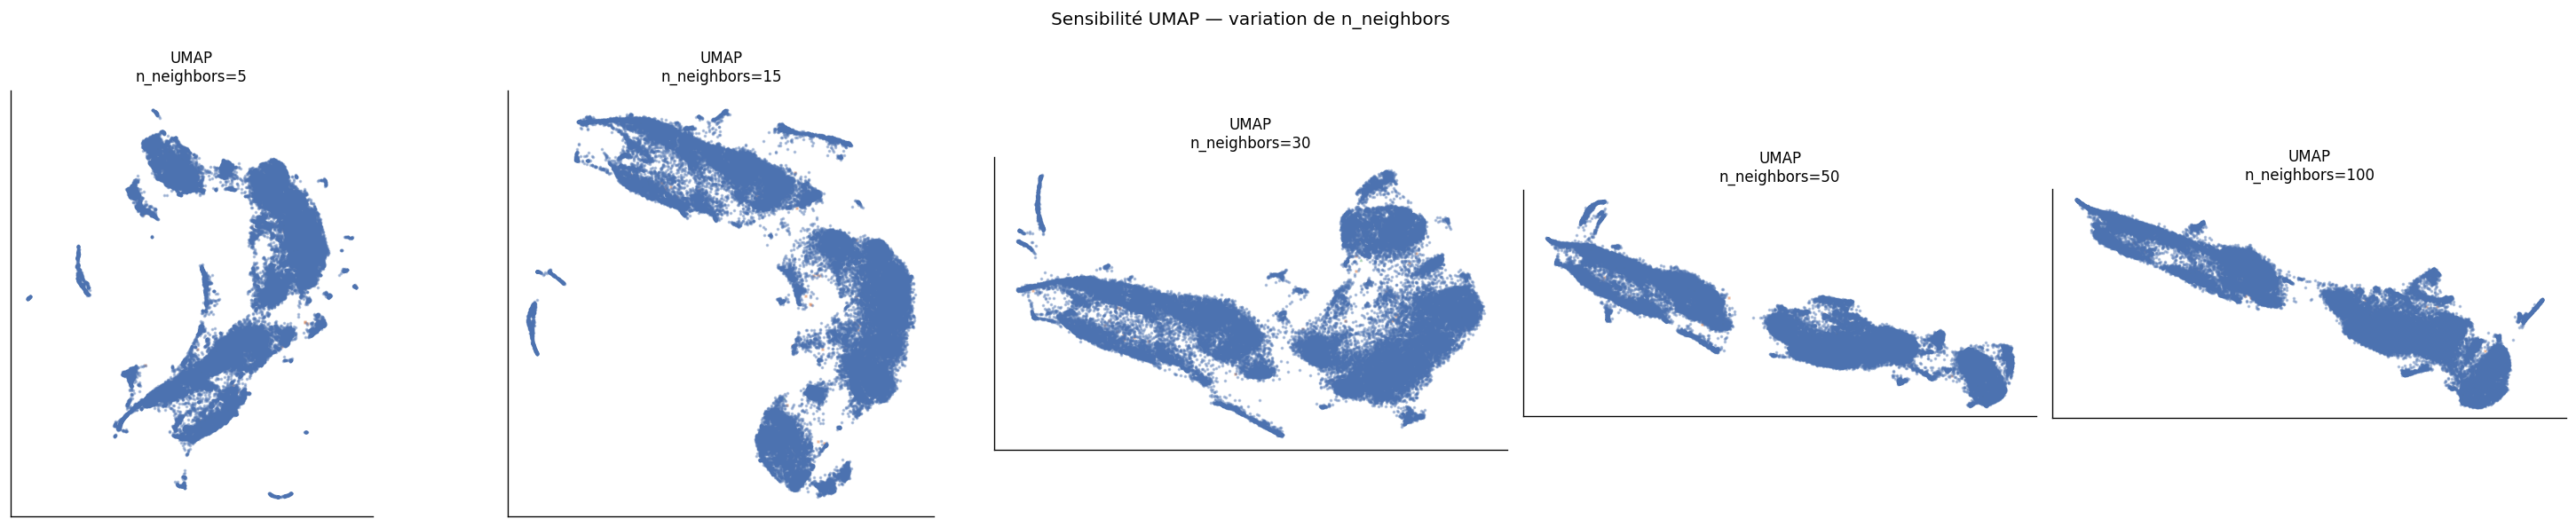
UMAP sensitivity to n_neighbors parameter
See also
- PCA — Physical Interpretation — linear baseline for comparison
- t-SNE & Stability — probabilistic counterpart
- PCA vs UMAP vs AE Comparison — systematic comparison table
- SHAP Interpretability — supervised validation of UMAP structure