Guide: Visualization
Visualization is essential for understanding the data, debugging the pipeline, and interpreting model results. The AstroSpectro project integrates a suite of advanced visualization tools, mainly orchestrated by the 02_tools_and_visuals.ipynb notebook and the AstroVisualizer class.
The Augmented Spectrum Analyzer (Main Tool)
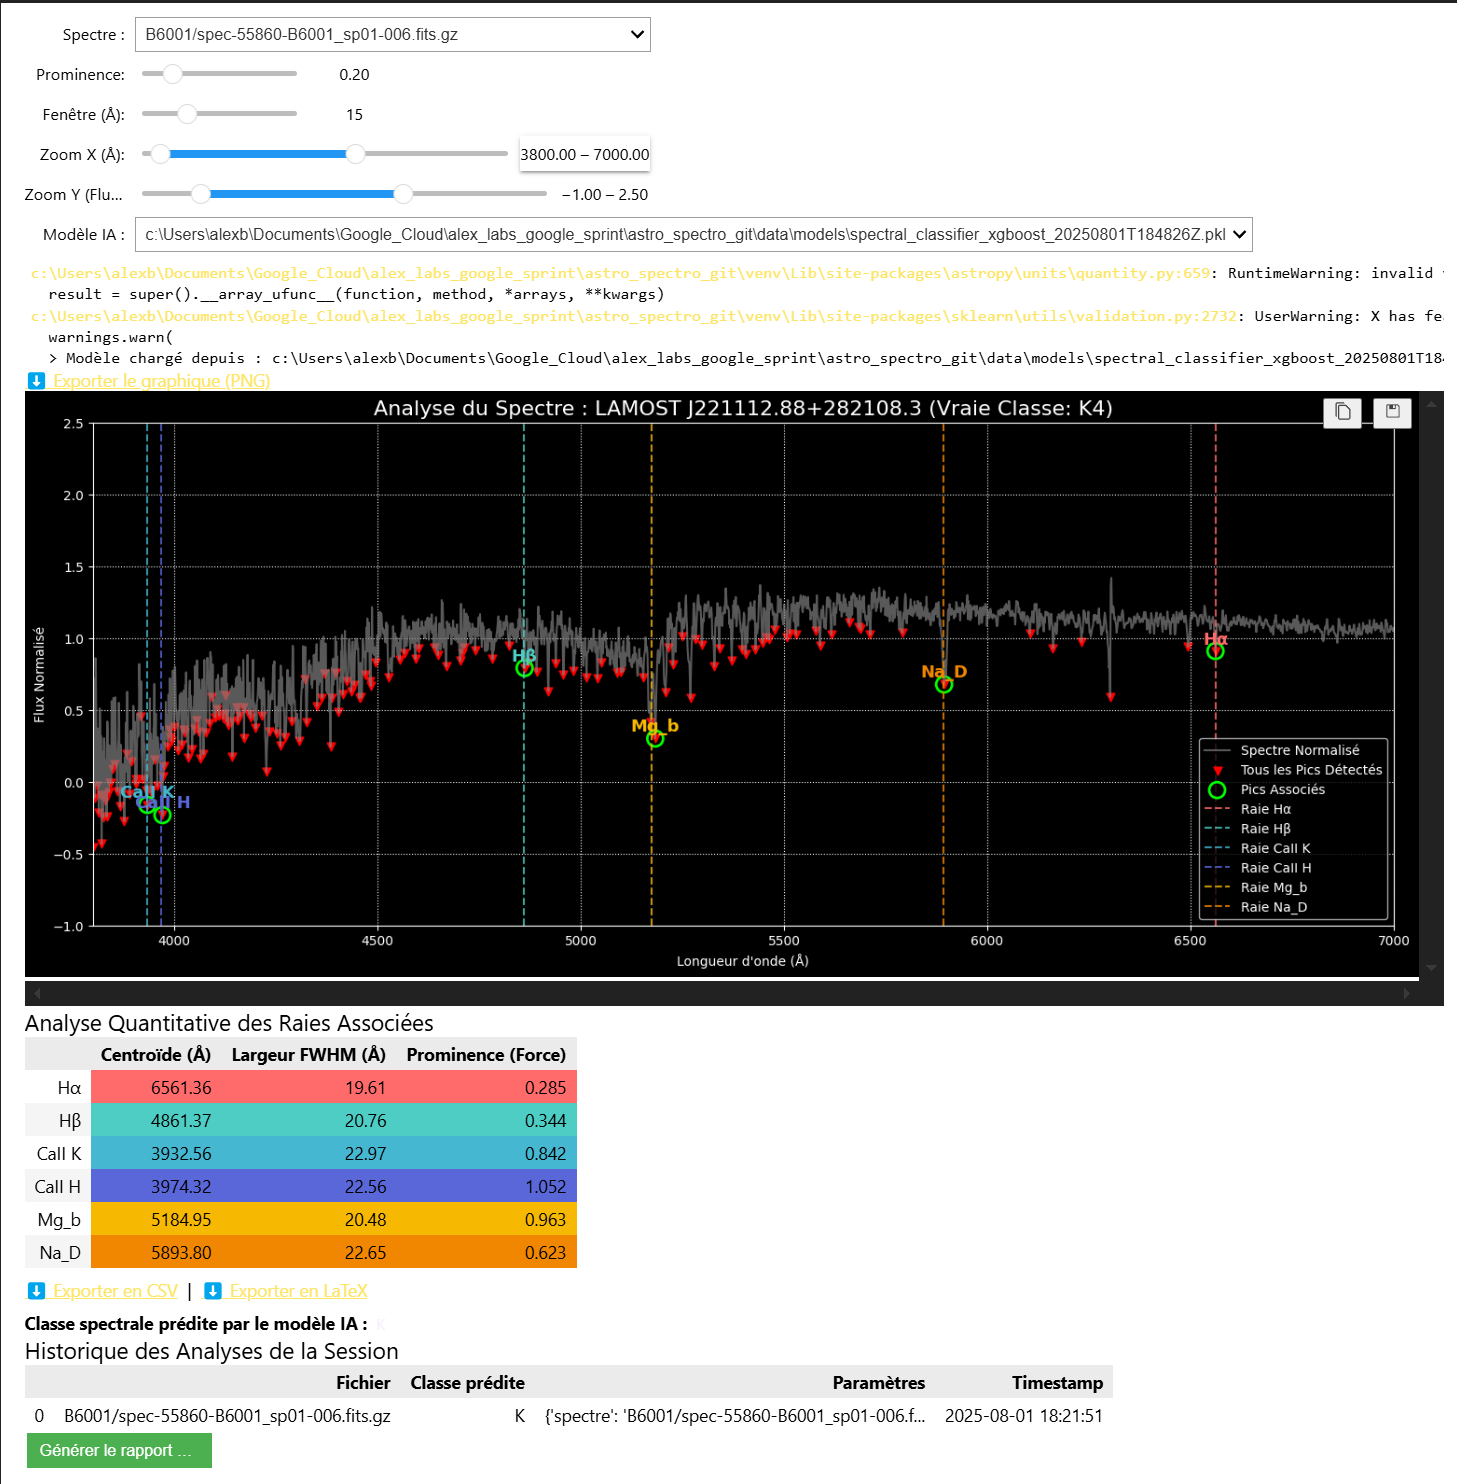
This is the project's "all-in-one" exploration tool. Accessible through the 02_tools_and_visuals.ipynb notebook, this interactive interface allows you to:
- Browse the full set of downloaded spectra.
- Adjust in real time the peak-detection parameters (
prominence,window). - Visualize the impact of these parameters on line detection (green circles).
- Obtain a live spectral-class prediction by selecting a trained AI model.
- View a quantitative analysis of detected lines (Centroid, FWHM, Strength).
- Export plots (PNG) and analyses (CSV, LaTeX).
- Generate a complete HTML report of your analysis session.
The image below shows the complete interface in action: the spectrum, tuning parameters, selected AI model, plot with detected lines, analysis table and session history.
The application is hosted on Streamlit Community Cloud and is accessible directly below. It is a simplified version of what is available in the 02_tools_and_visuals notebook.
The application is built with Streamlit and uses the project's visualizer.py module. It is automatically deployed from the deploy-streamlit branch of the GitHub repository.
Other Visualization Tools
The 02_tools_and_visuals.ipynb notebook also contains other specialized diagnostic tools.
Dataset State Dashboard
Displays key statistics about your data collection: total number of spectra, number already used for training, and number of new spectra available.
FITS Header Explorer
An interactive interface for browsing and displaying the complete contents of the header of any FITS file in your collection.
Feature Quality Analysis
This tool loads the latest generated features file and displays a bar chart showing the percentage of null values for each feature. It is a crucial tool for diagnosing extraction problems.
Sky Coverage Map
Generates a Mollweide-projection sky map showing the position of all observation plans you have downloaded. The size and color of the points indicate the density of spectra per plan.
Trained Model Inspector
Allows you to select any saved .pkl model and display its optimized hyperparameters as well as a chart of each feature's importance for its predictions.
Interactive Spectrum Comparator
A tool for overlaying multiple spectra on the same plot, with normalization and vertical-offset options to make visual comparison easier.