XGBoost — Classification Performance
This page documents the results of the reference XGBoost classifier, run ST_350k_xgb_AFGKM_v6, trained on the 350k-spectrum generation (G2: 349,998 spectra processed, 99 selected features, five types A, F, G, K, M). It also describes how classifier predictions relate to the unsupervised UMAP structure of the PHY-3500 study — a qualitative comparison made on a different dataset (G1) with an earlier model.
Key results
Run v6 (ST_350k_xgb_AFGKM_v6) was trained with spectro_only enabled, but its 99 selected features include 4 Gaia/photometric columns (M_G, M_BP, M_RP, ag_gspphot). Its metrics are therefore not purely spectroscopic; see the Data Leakage Audit.
Context and motivation
The conclusion of the PHY-3500 article (Baker, Caillat & Jean, 28 April 2026) uses an earlier classifier, run v5 (ST_100k_xgb_AFGKM_v5, 99,999 spectra processed), whose balanced accuracy on its own test set is 87.3%.
The article then projects the predictions of this model onto a different dataset. Its predictions, projected onto the UMAP embedding of the PHY-3500 dataset (PHY-3500 · G1 · 43,019 spectra), have a median confidence of 96.3% and follow the geography of the embedding. The article concludes that supervised and unsupervised methods capture the same physical structure, and that projections can serve as qualitative validation spaces for supervised models.
These v5 figures belong to that article and to G1; they are not the metrics of the reference run reported in Key results. Run v5 also includes a Gaia-derived column (M_G).
Experimental configuration
spectro_only=True mode
The reference run was trained with spectro_only=True in SpectralClassifier. The mode is meant to keep only flux-derived features; in addition to the columns that are always excluded (identifiers, ra/dec, redshift, seeing, SNR per band, GSP-Phot parameters, parallax, Gaia catalogue magnitudes), it removes every column whose name starts with a non-spectroscopic prefix (parallax, phot_, bp_rp, teff, logg, …).
The exclusion was prefix-based, and the Gaia-derived columns M_G, M_BP, M_RP and ag_gspphot match none of the prefixes: they reached the selected features of the reference run (see the caution above and Classification). The metrics below are therefore those of a mostly — not purely — spectroscopic model. The code has since been fixed with an explicit list of Gaia/photometric columns, but no complete spectro-only reference run exists yet.
Training data
from src.pipeline.classifier import SpectralClassifier

clf = SpectralClassifier(
    model_type="XGBoost",
    prediction_target="main_class",
)
clf.train_and_evaluate(features_df, spectro_only=True)
Classification results
Per-class performance — the Harvard sequence
F/G confusion — the trickiest boundary
The main confusion of the reference run is between F and G: true F predicted G (1,478 test spectra) and true G predicted F (2,179), and these two classes have the lowest F1 scores (F 0.822, G 0.861). The two types are adjacent in temperature and differ by gradual changes in line strengths; on the PHY-3500 UMAP (G1, model v5), the disputed spectra lie in the transition zone between the two populations. Full analysis: F/G Confusion Analysis.
Geographic coherence in UMAP space
Principle of supervised/unsupervised cross-validation
This section uses the PHY-3500 dataset (PHY-3500 · G1 · 43,019 spectra) and the predictions of run v5, not the reference run. The UMAP projection of XGBoost predictions allows qualitative validation of a model: if the supervised classifier has learned the same physical structure as UMAP (unsupervised), predictions should follow the geography of the projection.
Results
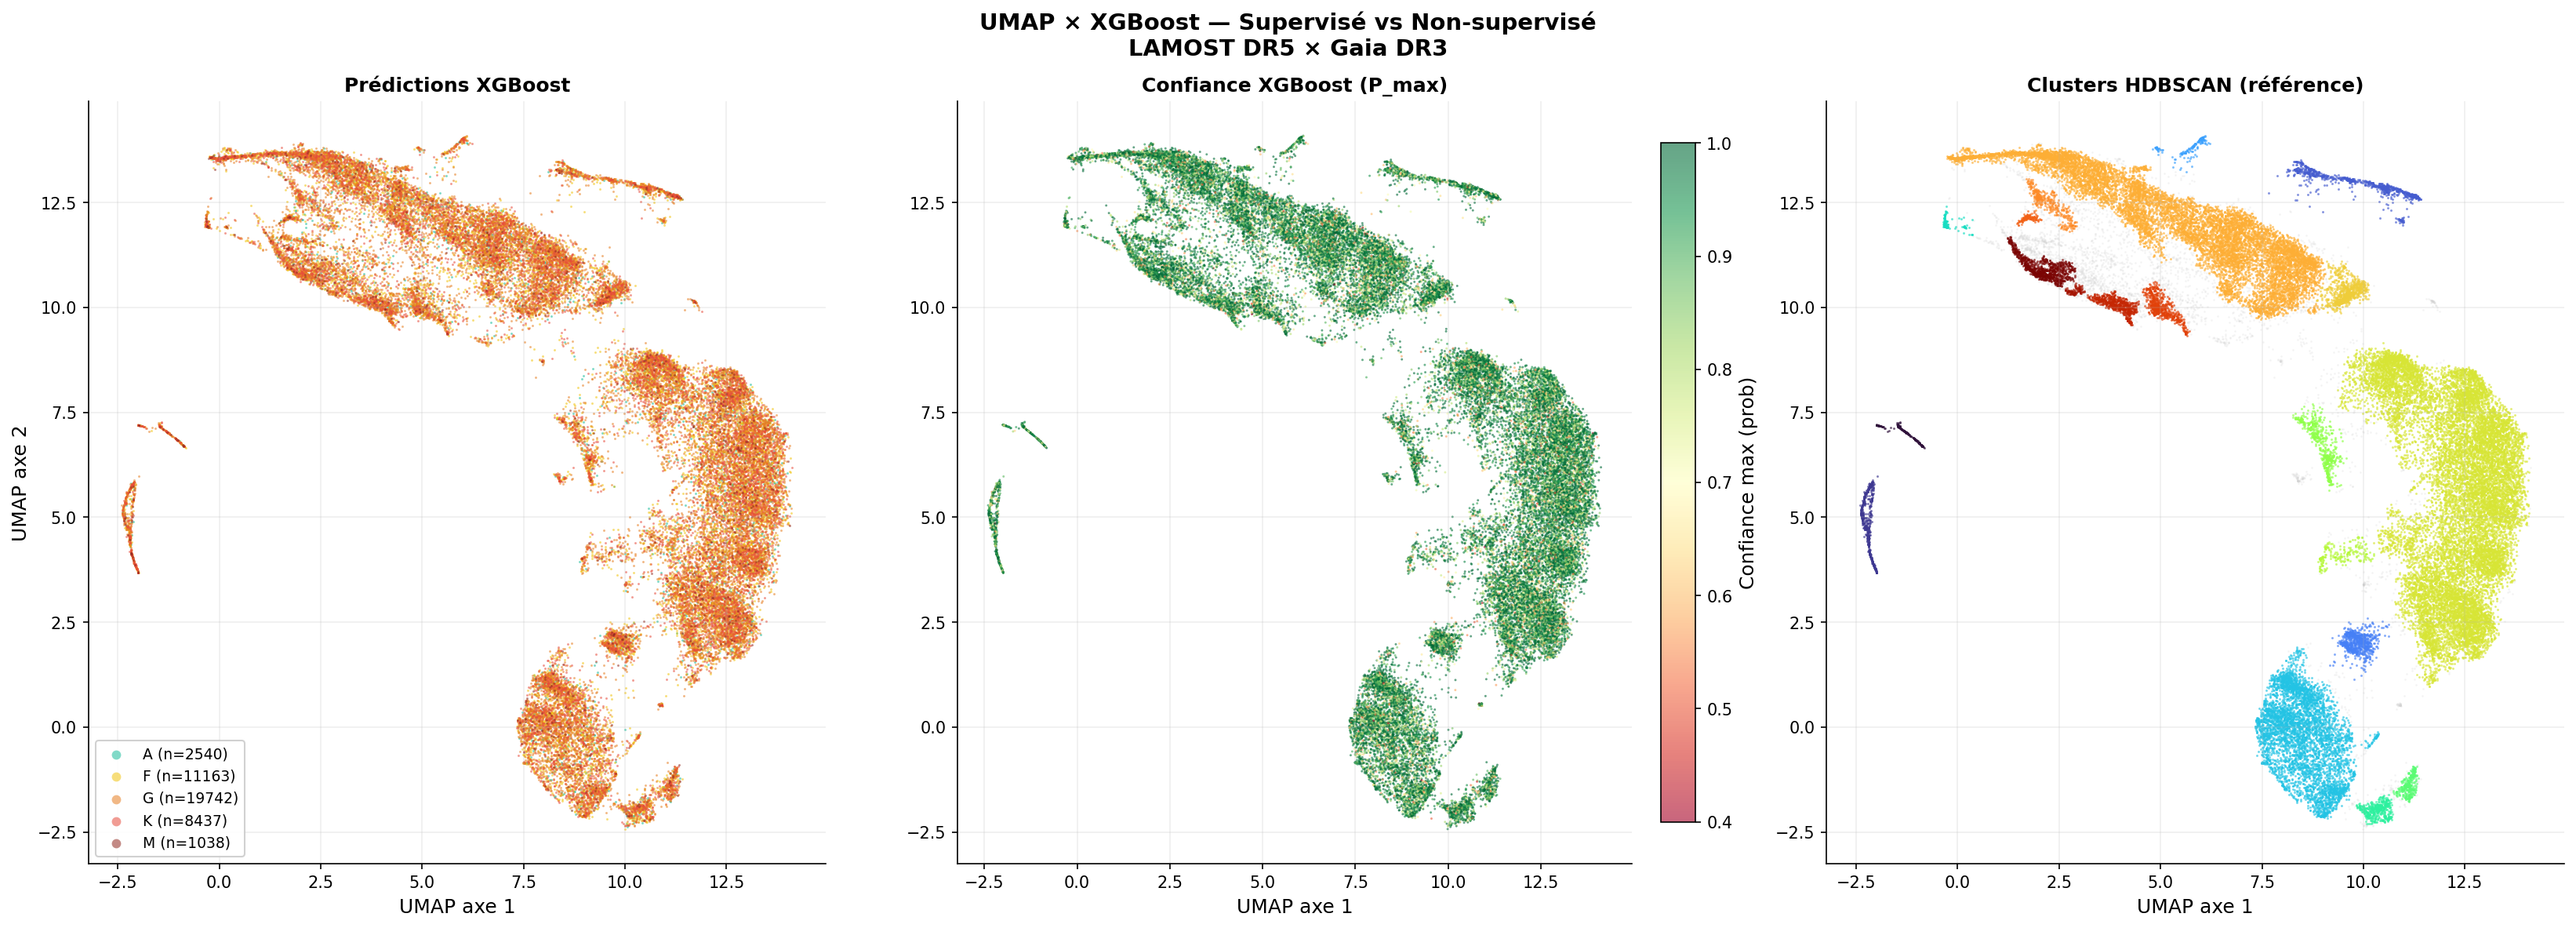
42,920 predictions of ST_100k_xgb_AFGKM_v5 (v5) projected on the PHY-3500 · G1 UMAP. The XGBoost geography in UMAP is consistent with the unsupervised structure: supervised and unsupervised methods capture the same physics.
This direct correspondence between the emergent structure of UMAP (without labels) and XGBoost classification (with labels) demonstrates that both approaches capture the same underlying physical structure: the effective temperature sequence of Harvard's MK classification.
SHAP interpretability — which features decide?
SHAP (SHapley Additive exPlanations) analysis of the reference run shows which features drive its decisions: 96.8% of the total mean |SHAP| goes to spectroscopic features and 3.2% to Gaia/photometric columns (share of total importance, not of the top-30).
ST_350k_xgb_AFGKM_v6.PCA vs XGBoost — two questions, two answers
PCA ranks features by the variance they carry, XGBoost by how much they help separate the classes; the two rankings answer different questions. The comparison below uses the PHY-3500 PCA (G1) and the SHAP run of the same generation (model v5):
Link to the complete AstroSpectro pipeline
This result is part of a coherent progression of the AstroSpectro project:
Using the model
Load and predict
from src.pipeline.classifier import SpectralClassifier

# Load a saved model (<ts> = run identifier)
clf = SpectralClassifier.load_model(
    "data/models/spectral_classifier_xgboost_<ts>.pkl"
)

# Predict on new spectra (same feature format)
predictions = clf.model_pipeline.predict(X_new)
probabilities = clf.model_pipeline.predict_proba(X_new)
Reference run metadata
Each run is documented by:
data/models/
├── spectral_classifier_xgboost_<ts>.pkl
└── spectral_classifier_xgboost_<ts>_meta.json
data/reports/<ts>/
└── session_report_xgboost_<ts>.json
For the reference run, <ts> = 20260522T161236Z. Its meta JSON contains the final hyperparameters, the 99 selected features (out of 207 candidates), the class labels and the training file (features_20260522T153123Z.csv); the session report records the model MD5 hash (e752bb7ce5494364364f77a4200aa480). See Reproducibility.