F/G Confusion Analysis
This page documents where the reference XGBoost classifier confuses F and G stars and why this boundary is expected to be ambiguous. Metrics and SHAP figures come from the reference run on the 350k-spectrum generation (G2); the UMAP picture of the transition zone comes from the PHY-3500 dimensionality-reduction study (PHY-3500 · G1 · 43,019 spectra) and is discussed separately.
Key results
Reference run ST_350k_xgb_AFGKM_v6, test set of 60,947 spectra:
| Quantity | F | G |
|---|---|---|
| Precision | 0.810 | 0.885 |
| Recall | 0.835 | 0.839 |
| F1 | 0.822 | 0.861 |
| Test spectra (support) | 12,803 | 21,902 |
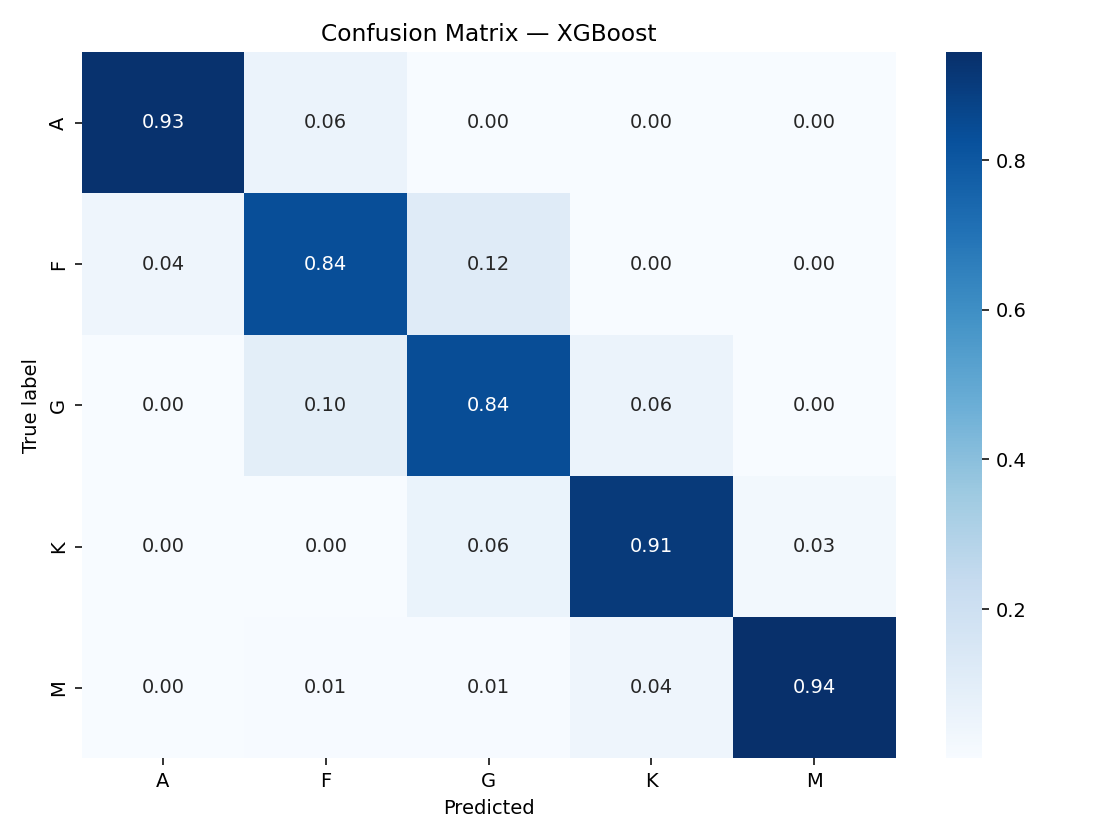
| Misclassified into the other class | 1,478 true F predicted G | 2,179 true G predicted F |
For comparison, the other errors of these two classes: true F predicted A 560, true G predicted K 1,279, true K predicted G 856.
Run v6 (ST_350k_xgb_AFGKM_v6) was trained with spectro_only enabled, but its 99 selected features include 4 Gaia/photometric columns (M_G, M_BP, M_RP, ag_gspphot). Its metrics are therefore not purely spectroscopic; see the Data Leakage Audit.
Where the errors are
Result
In the reference run, the two largest off-diagonal cells of the confusion matrix are G predicted as F and F predicted as G, and F and G have the lowest F1 scores of the five classes. The errors are between neighbours in the temperature sequence: G stars are otherwise confused with K, F stars with A, and almost never with distant types.
Interpretation
Spectral types are bins cut into a continuous temperature sequence. Near the F/G boundary, consecutive subtypes (late F, early G) differ by small changes in line strengths, so a spectrum close to the cut can carry the label of either side. Errors that stay between adjacent classes are the pattern expected from a classifier that has learned the ordering of the sequence; random errors would spread over all classes.
Caveat
The labels are the LAMOST pipeline types, not an independent reference. Part of the F/G "errors" may therefore come from the labels themselves; the exported results do not allow separating classifier errors from label noise.
Which features separate F from G
Result
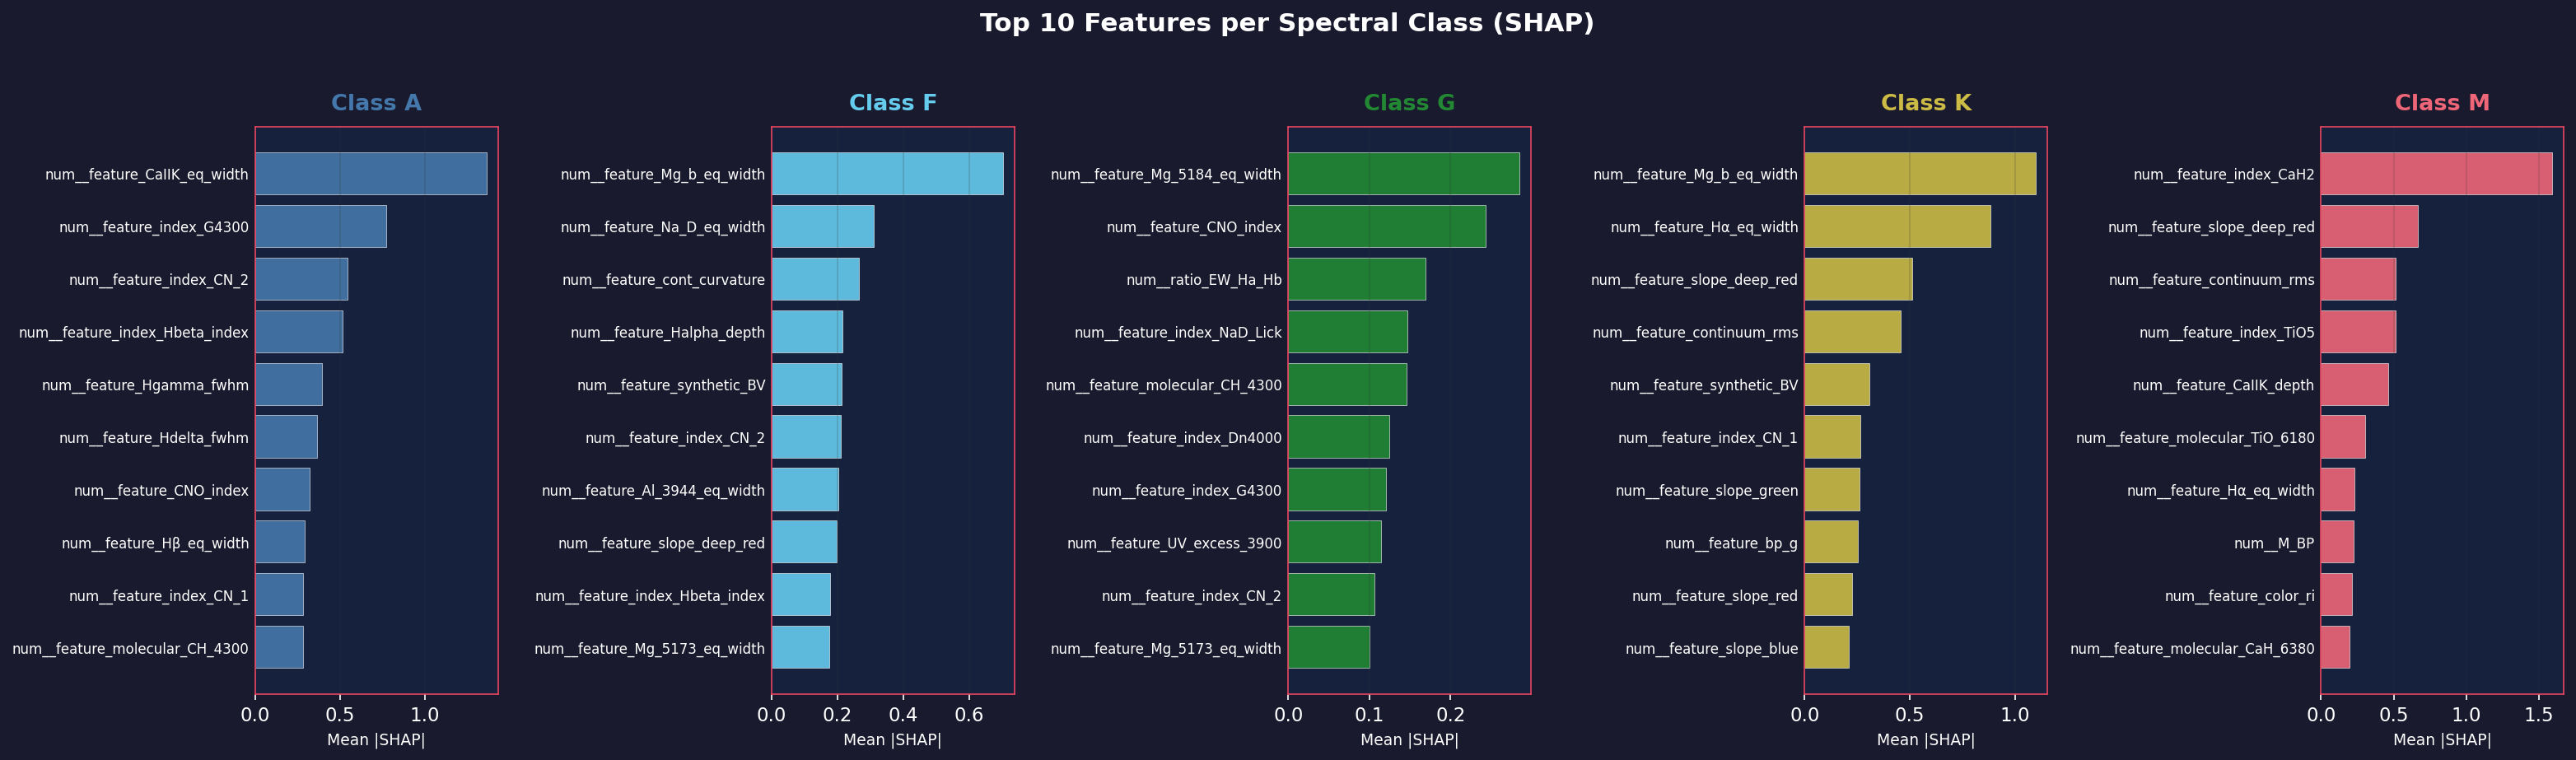
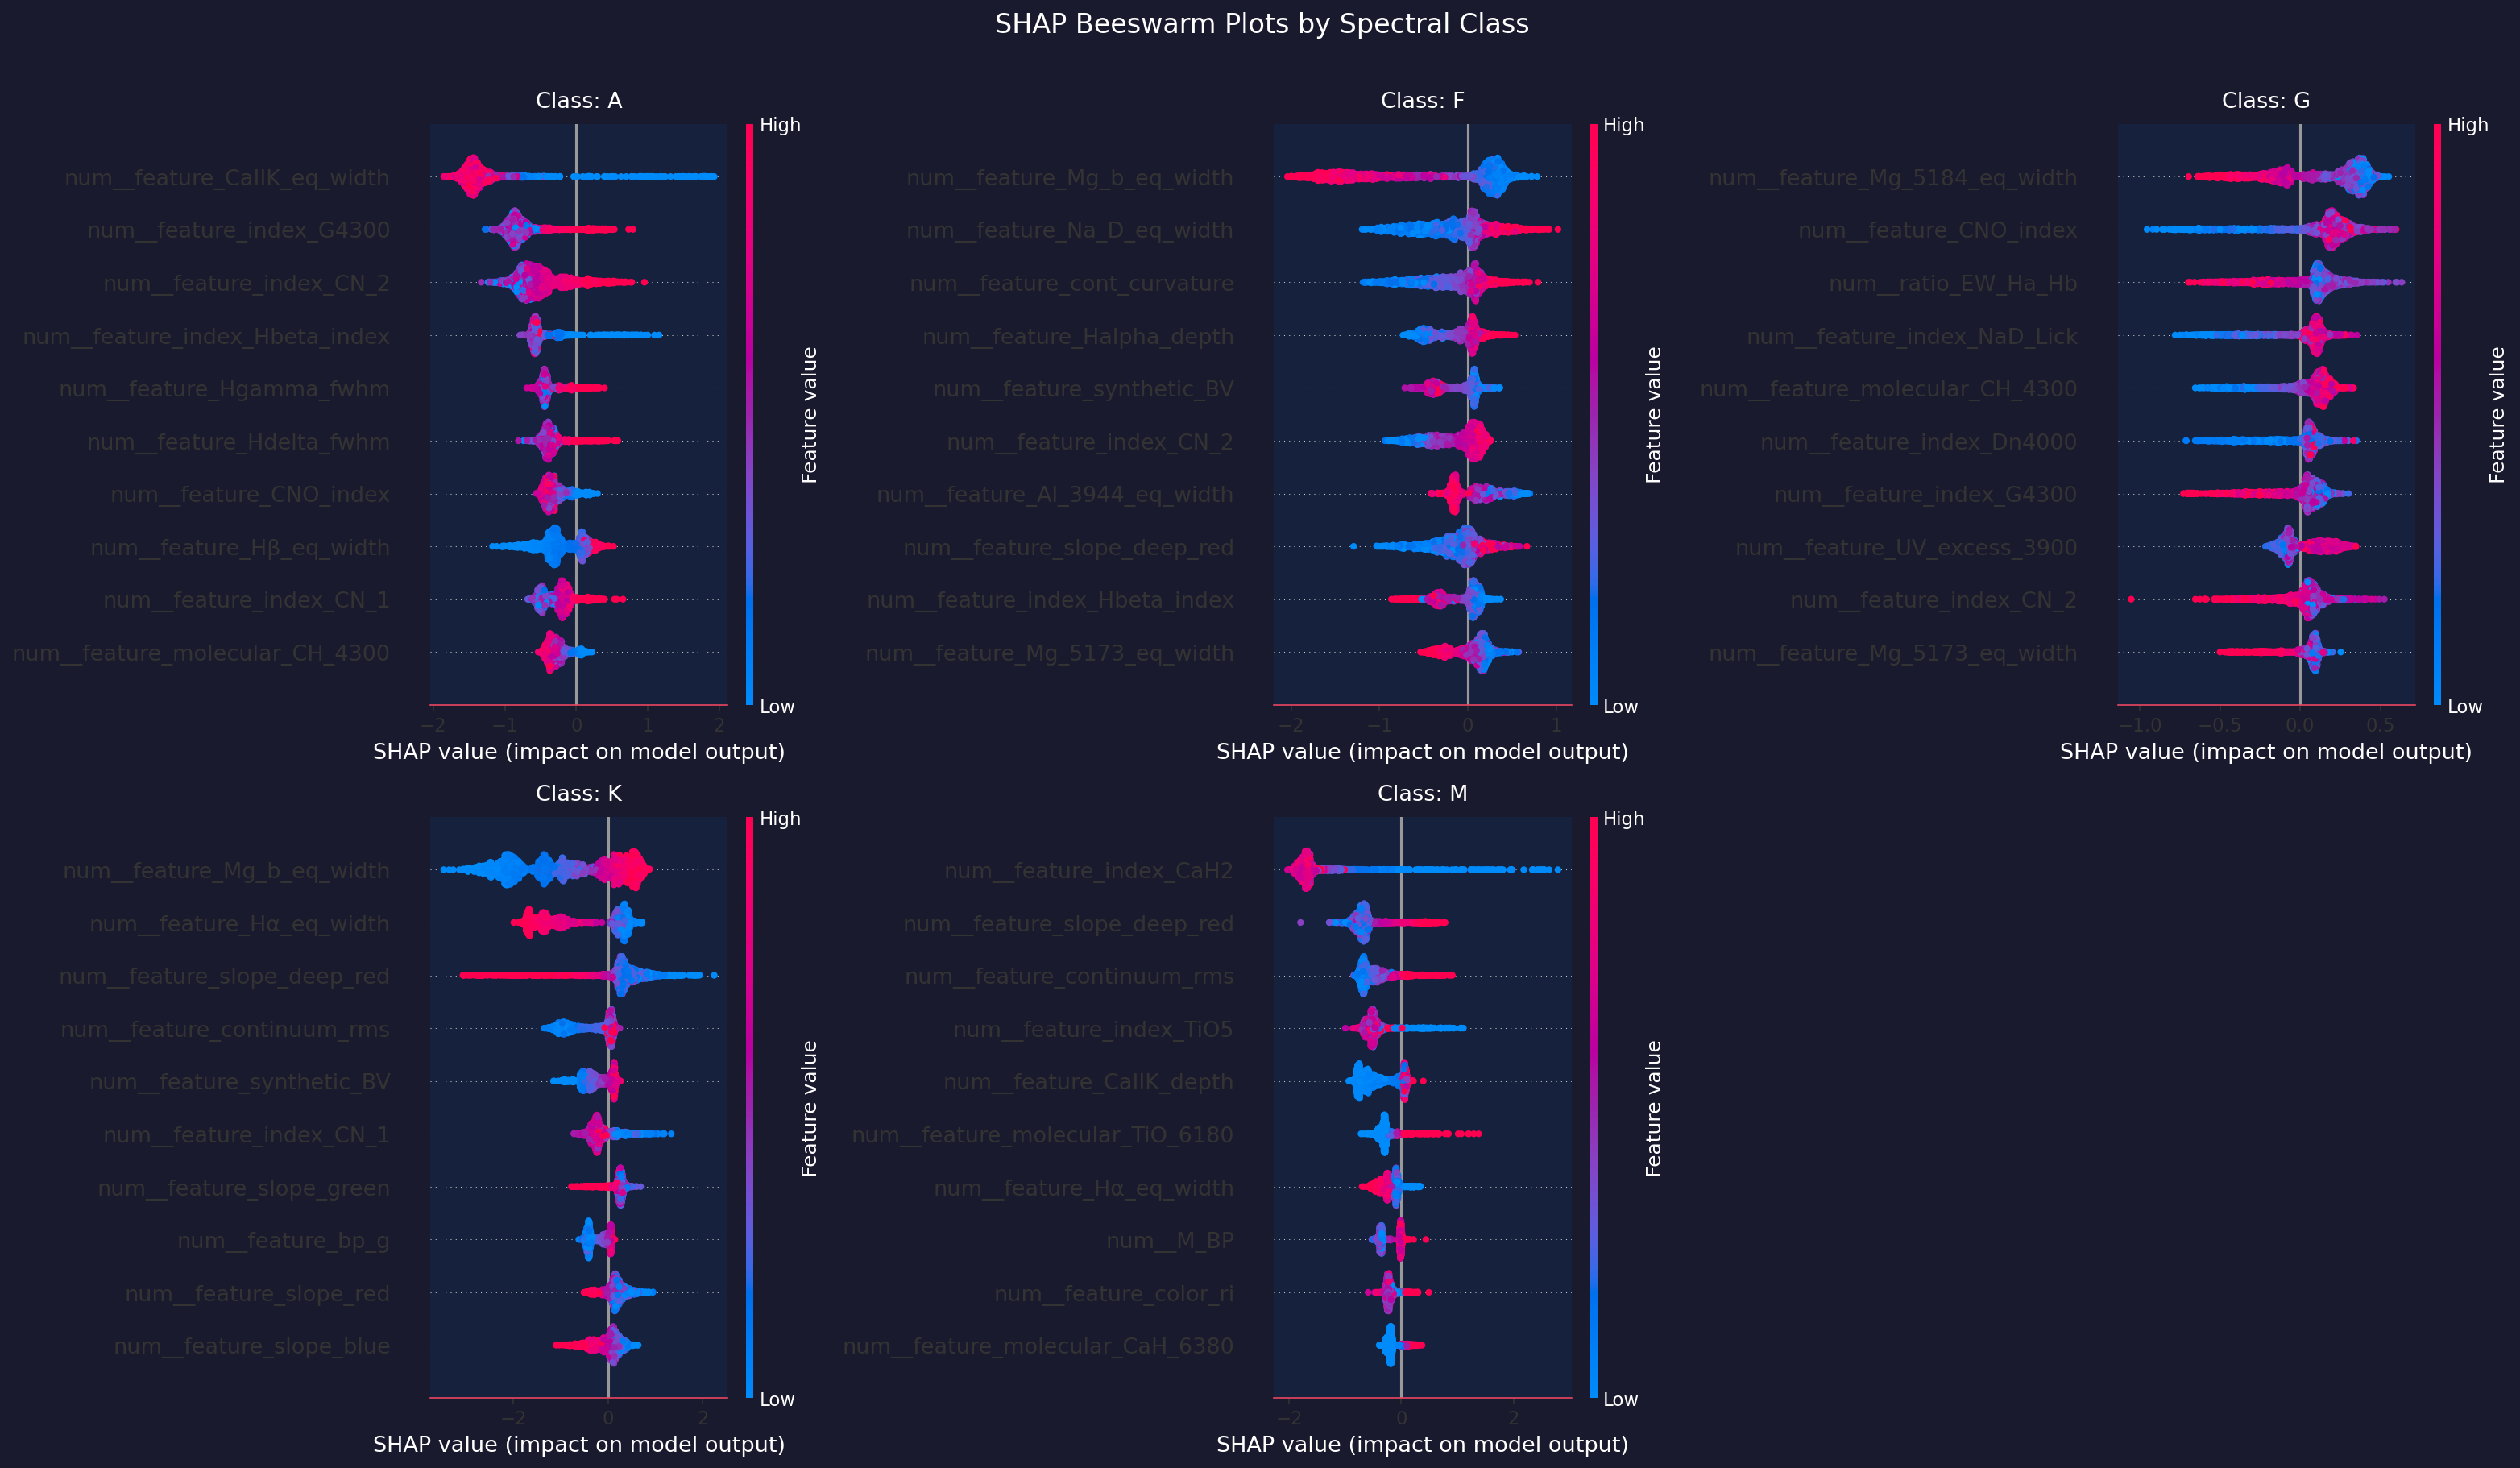
The per-class SHAP attribution of the reference run (logs/shap/features_20260522T153123Z/01_data_leak/) ranks different features at the top for the two classes. For F, the leading features are the Mg b equivalent width, the Na D equivalent width and the continuum curvature. For G, the Mg I 5184 Å equivalent width, the CNO index and the Hα/Hβ equivalent-width ratio lead. The leading features of F and G have smaller mean |SHAP| values than those of A, K and M.
Interpretation
Between F and G, the classifier relies on a combination of moderate signals — the growth of metal lines (Mg b, Na D) and the weakening of the Balmer lines as temperature decreases — rather than on one decisive line. A spread of small contributions is consistent with a boundary that is defined by gradual changes.
Caveat
The per-class ranking is read from the figure produced by the pipeline (mean |SHAP| per class); the per-class values are not part of the exported CSV. The SHAP run analyses a model that includes Gaia/photometric features.
The transition zone in UMAP (PHY-3500 · G1 · 43,019 spectra)
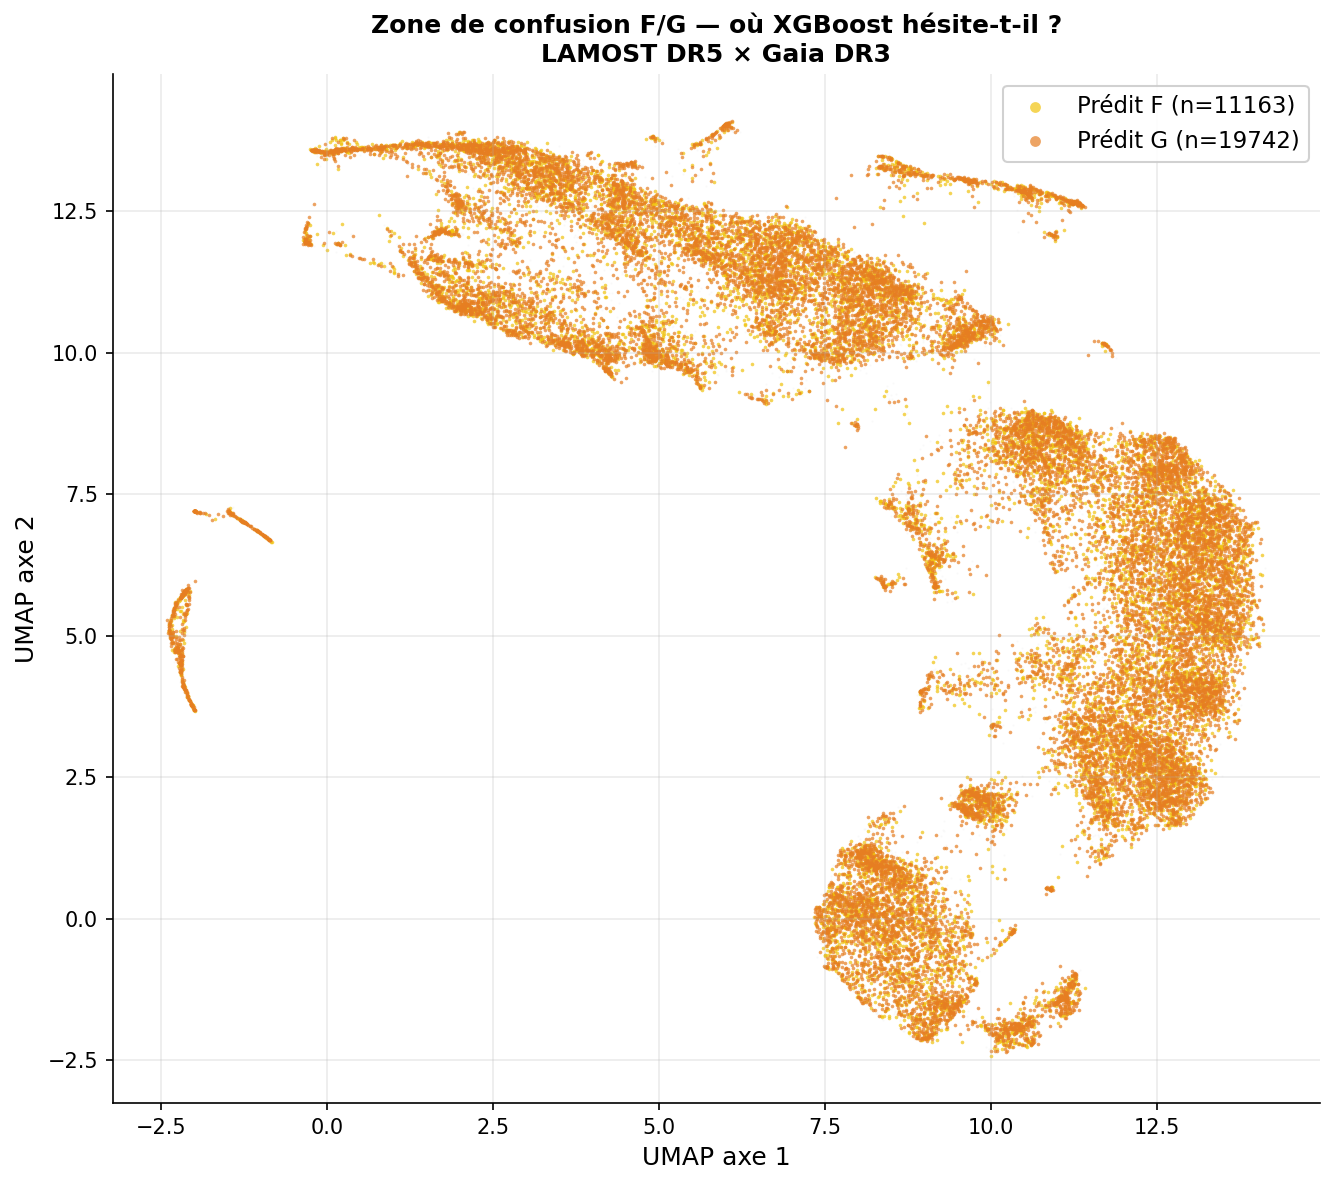
This section uses a different dataset and an older model: predictions of the XGBoost run v5 (ST_100k_xgb_AFGKM_v5) projected onto the UMAP embedding of the PHY-3500 dataset.
Result. Spectra whose predicted type differs between F and G concentrate along the zone where the F and G populations meet in the embedding, not in isolated islands.
Interpretation. The unsupervised embedding, built without labels, places these spectra between the two populations: the ambiguity is present in the features themselves, not introduced by the classifier.
Caveat. Qualitative, on G1 and with model v5 (which also includes a Gaia-derived column, M_G); it illustrates the mechanism but is not a measurement on the reference run.
Limitations of this result
- No independent reference classification (another survey or manual typing) is part of the exported results, so the share of label noise in the F/G errors is unknown.
- The analysis is at the level of main types; the subtype of misclassified spectra (late F vs early G) is not exported.
- All G2 numbers come from a run whose features include Gaia/photometric columns.