Results Analysis
This page presents the results of the AstroSpectro pipeline along two complementary axes that use different datasets. The unsupervised analysis (PCA, UMAP, t-SNE, HDBSCAN) runs on the PHY-3500 dataset: N = 43,019 LAMOST DR5 × Gaia DR3 spectra described by p = 183 spectroscopic features (PHY-3500 · G1 · 43,019 spectra). The supervised classification (XGBoost with SHAP attribution) is the reference run ST_350k_xgb_AFGKM_v6 on the 350k-spectrum generation (G2, 349,998 spectra processed).
Axis 1 — Unsupervised dimensionality reduction
PHY-3500 · G1 · 43,019 spectra.
PCA — The linear baseline
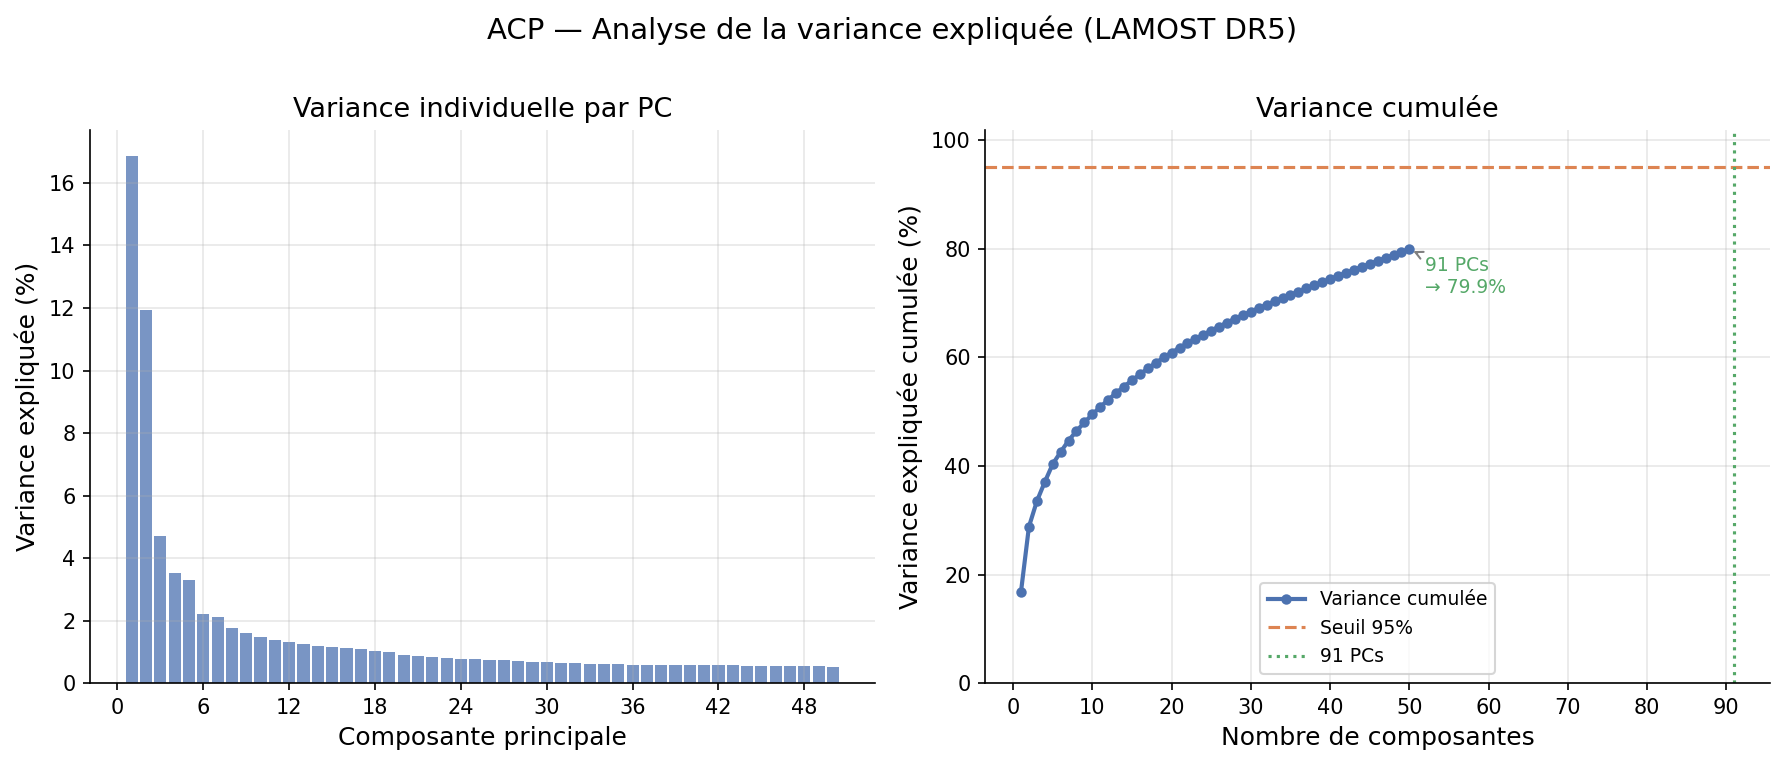
PCA on the 183 standardised features reveals high intrinsic dimensionality: 91 components are needed to capture 95% of variance, with no clear elbow in the eigenvalue spectrum.
| Threshold V(K) | Components K | Interpretation |
|---|---|---|
| 28.8% | 2 | PC1 + PC2 only — visualisation |
| 80% | 51 | Fast analysis |
| 95% | 91 | Retained threshold for UMAP/t-SNE |
| 99% | 100 | Near-total variance |
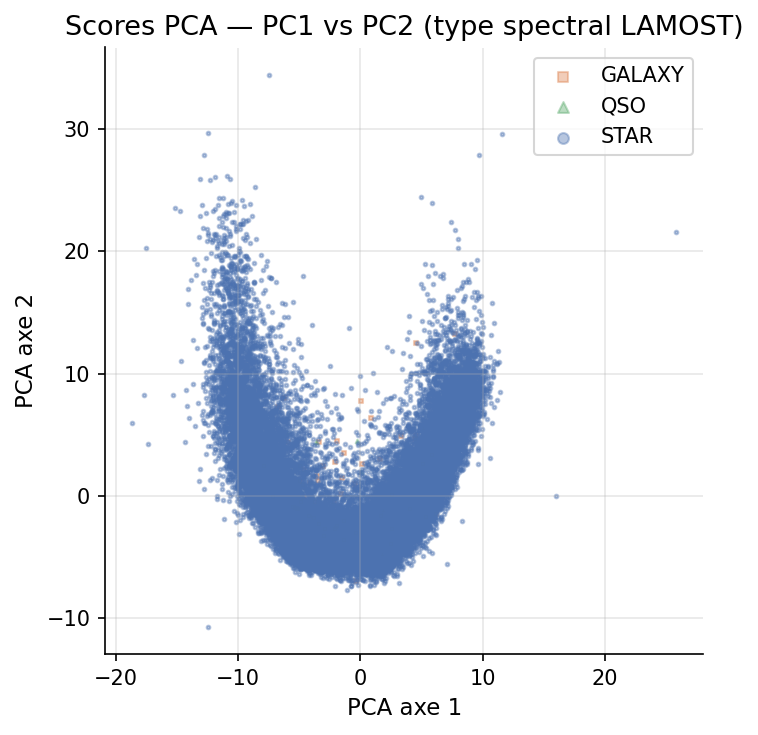
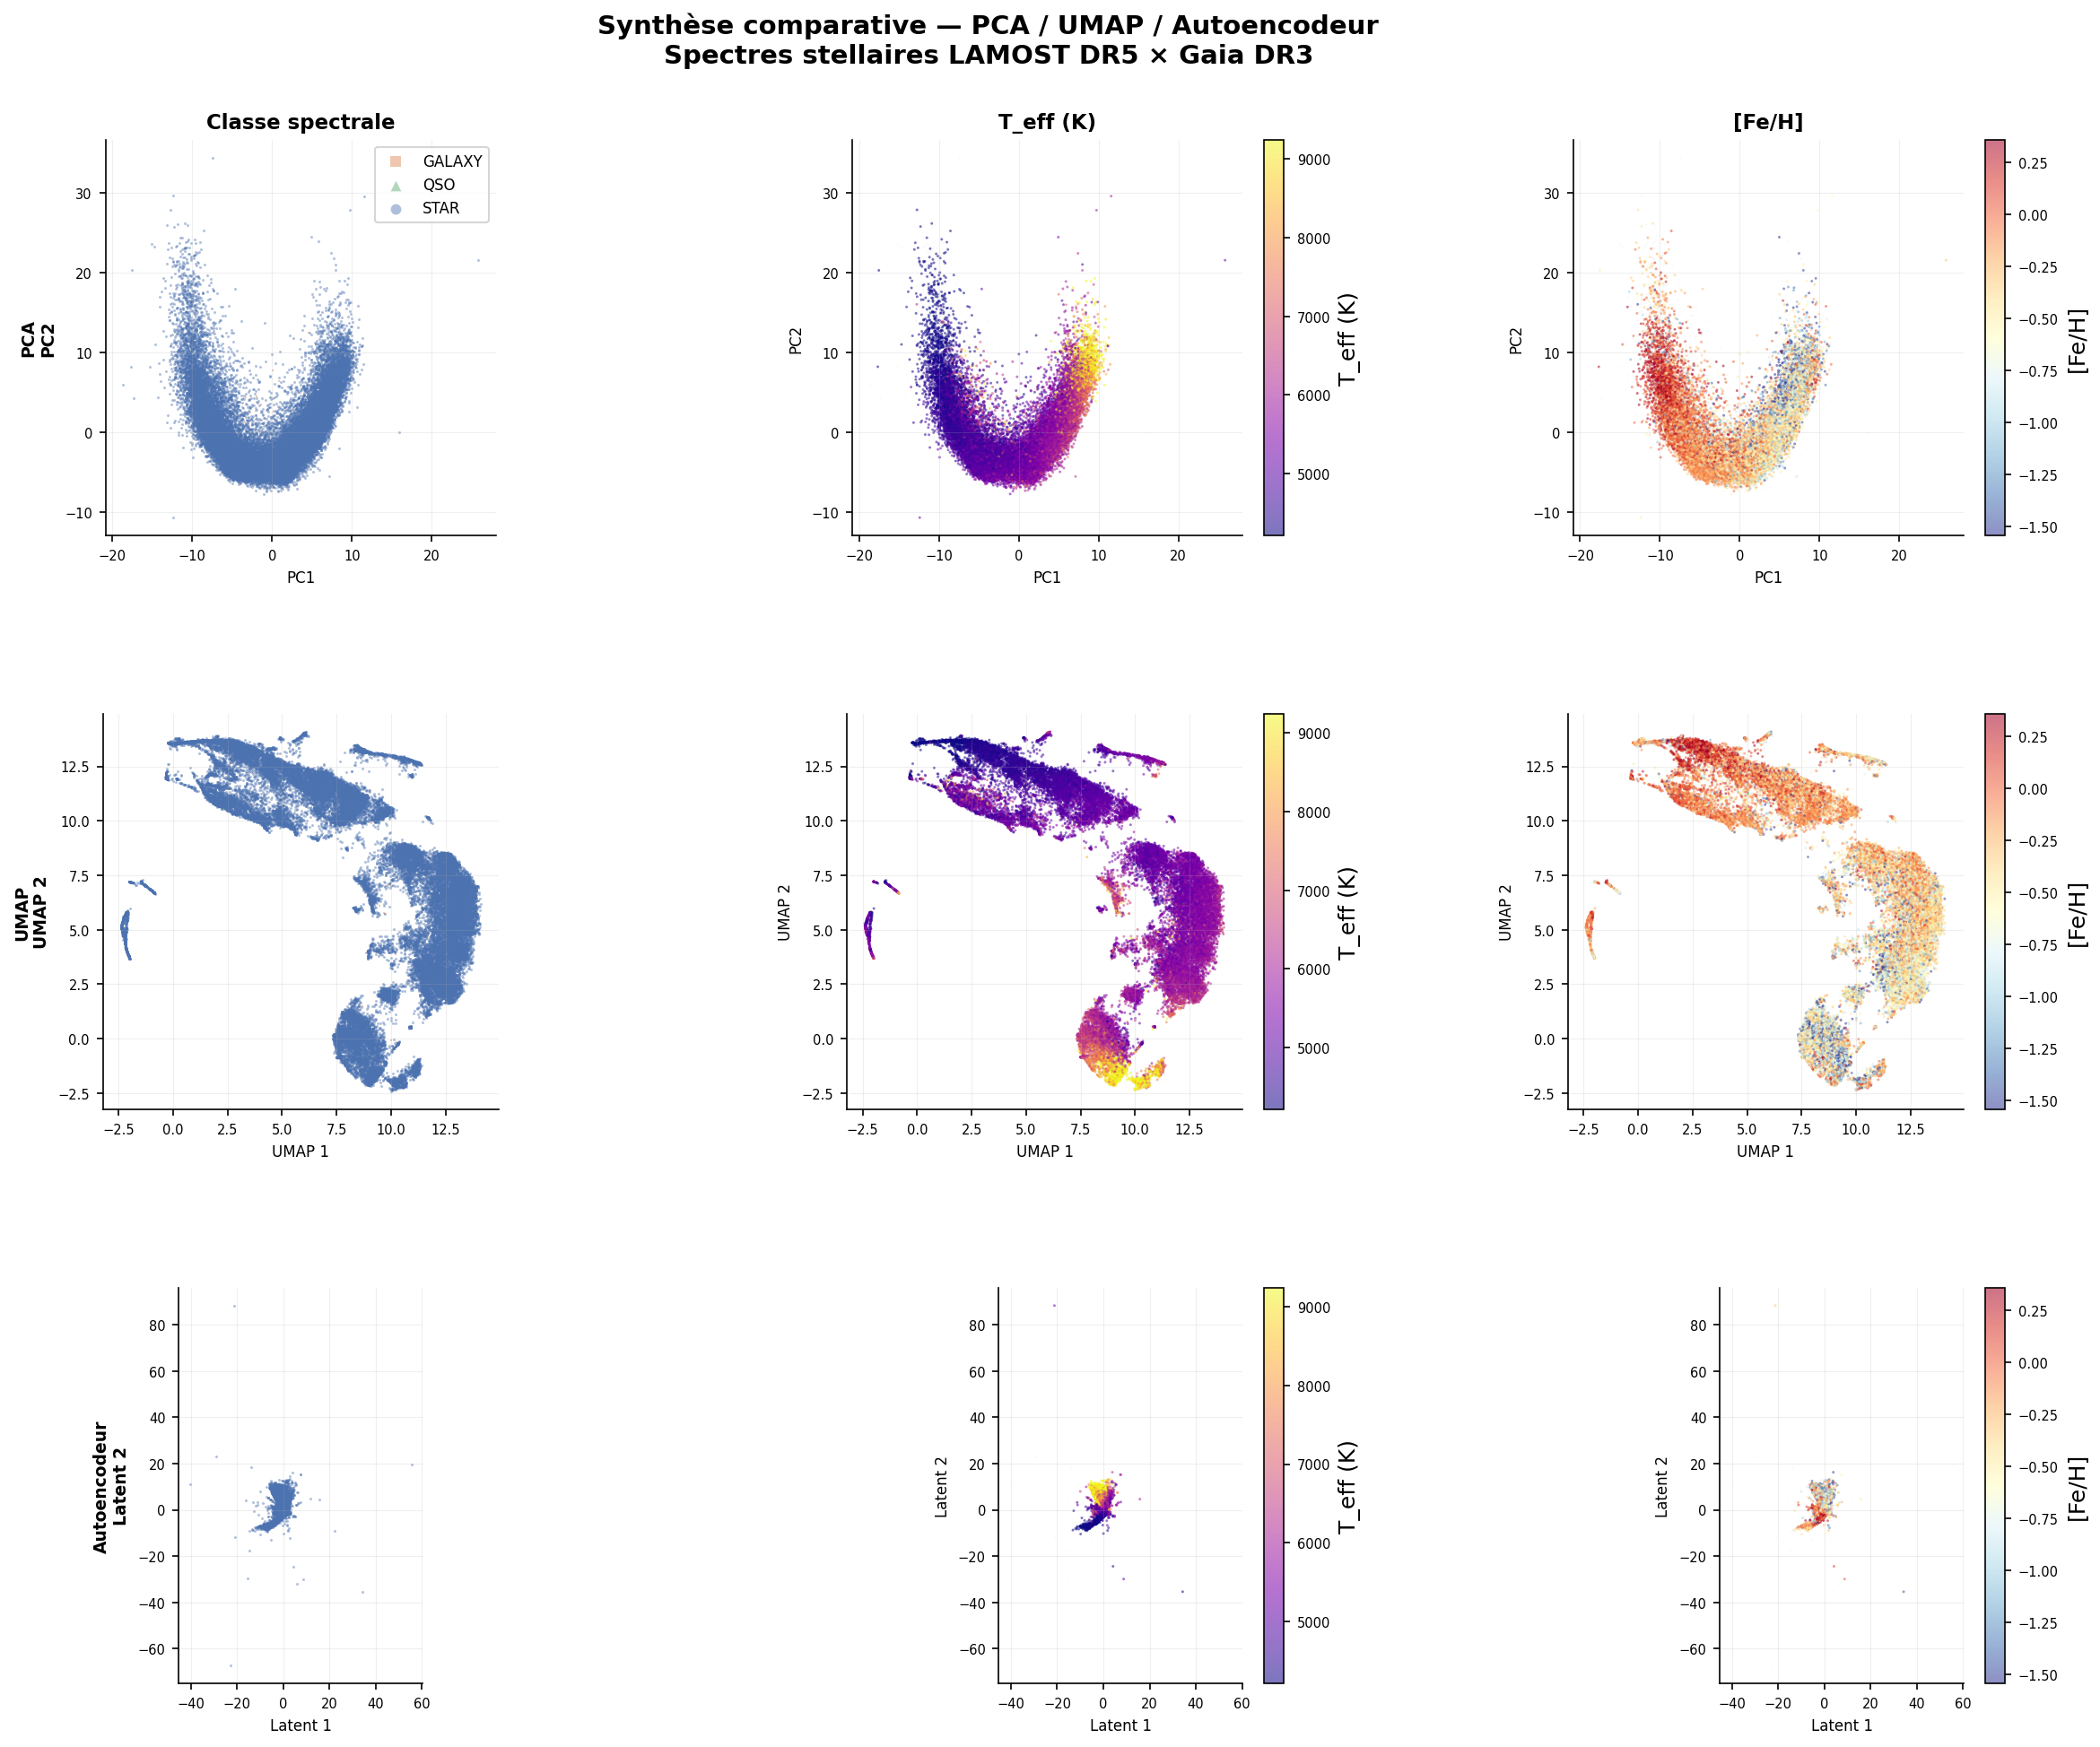
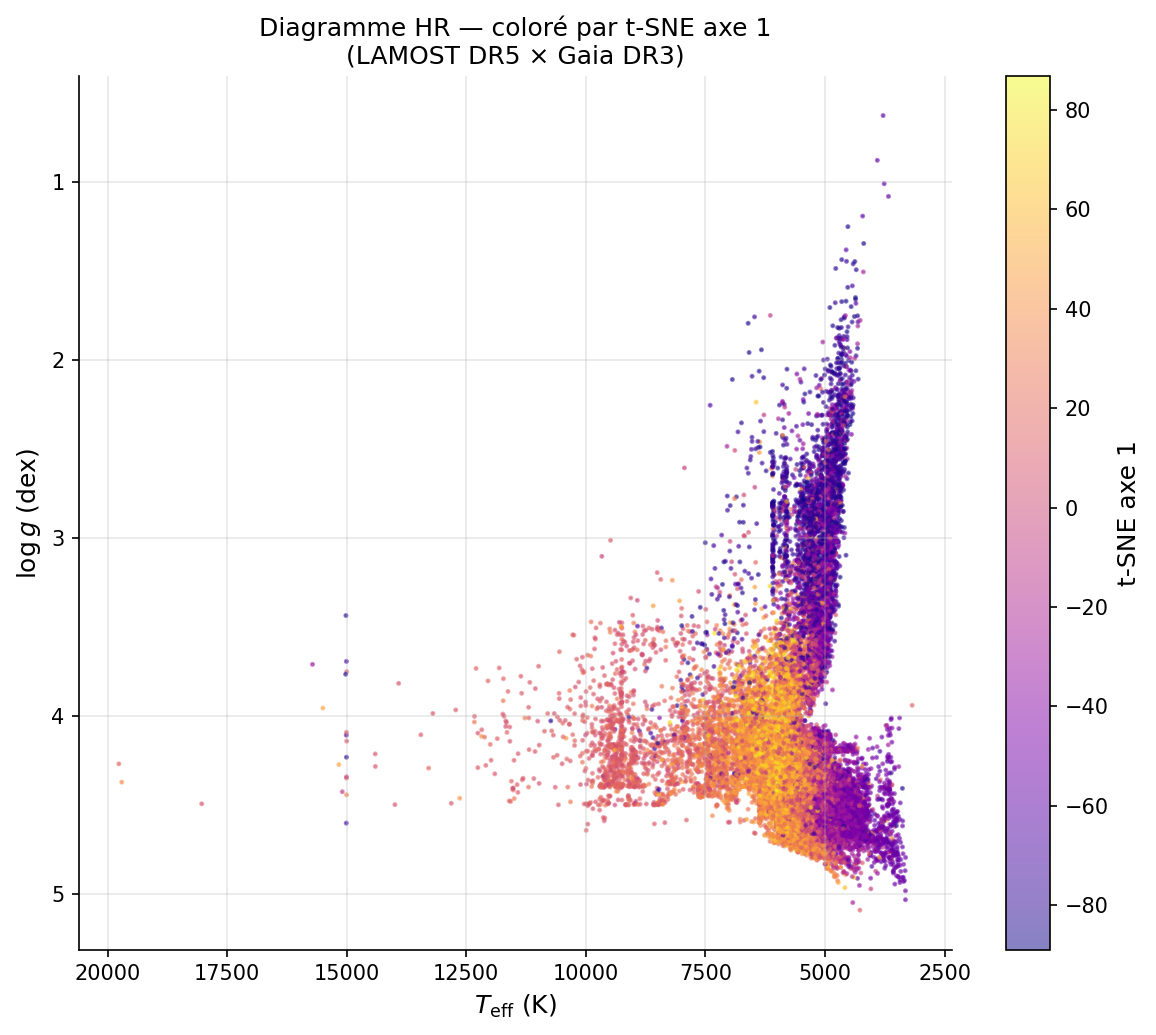
PC1 (16.9%, λ₁ = 30.19) — Thermal axis: ρ(PC1, Teff) = +0.831. Dominated by Balmer lines (31.5%) and ionised calcium (22.4%). Hot stars (A-F, > 7,000 K) occupy the positive side; cool stars (K-M, < 5,000 K) the negative side.
PC2 (12.0%, λ₂ = 21.39) — Metallicity axis (partially contaminated): Dominated by iron and metals (43.3%). The correlation ρ(PC2, SNRr) = −0.310 reveals instrumental contamination — PC2 is not a pure metallicity axis.
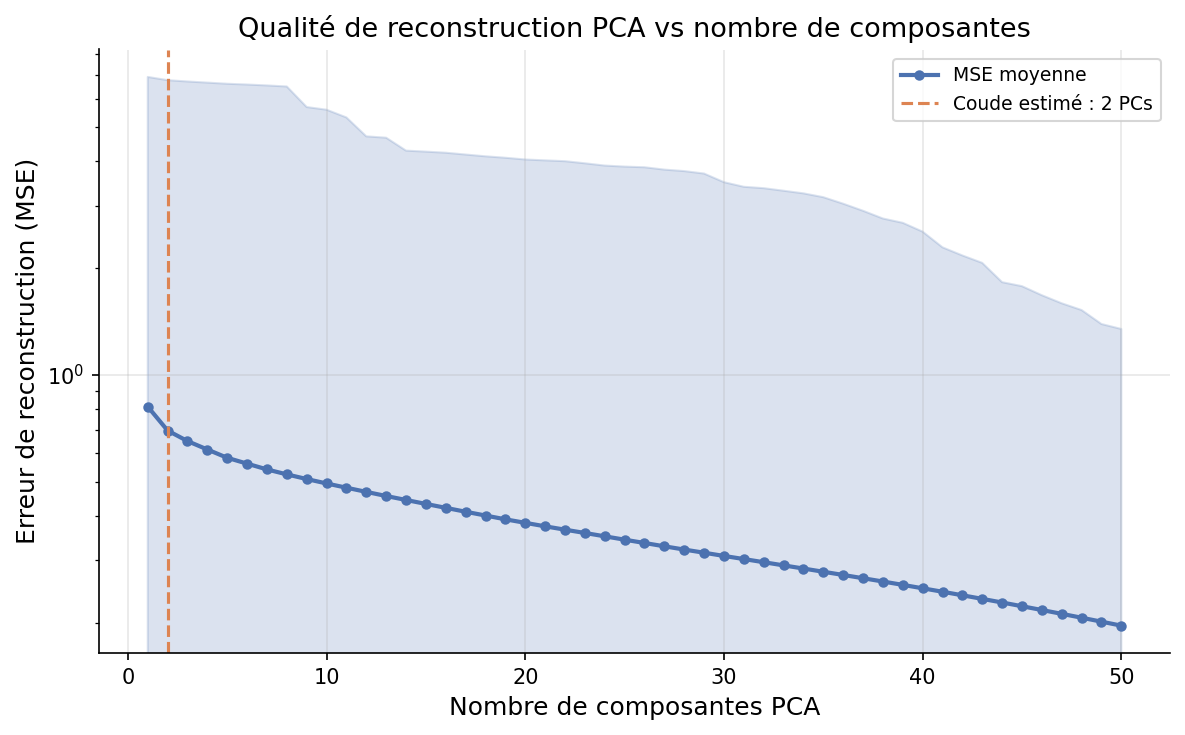
| K components | MSE(K) | Variance captured |
|---|---|---|
| 2 | 0.696 | 30.4% |
| 10 | 0.494 | 50.6% |
| 50 | 0.196 | 80.4% |
| 91 | ~0.050 | 95.0% |
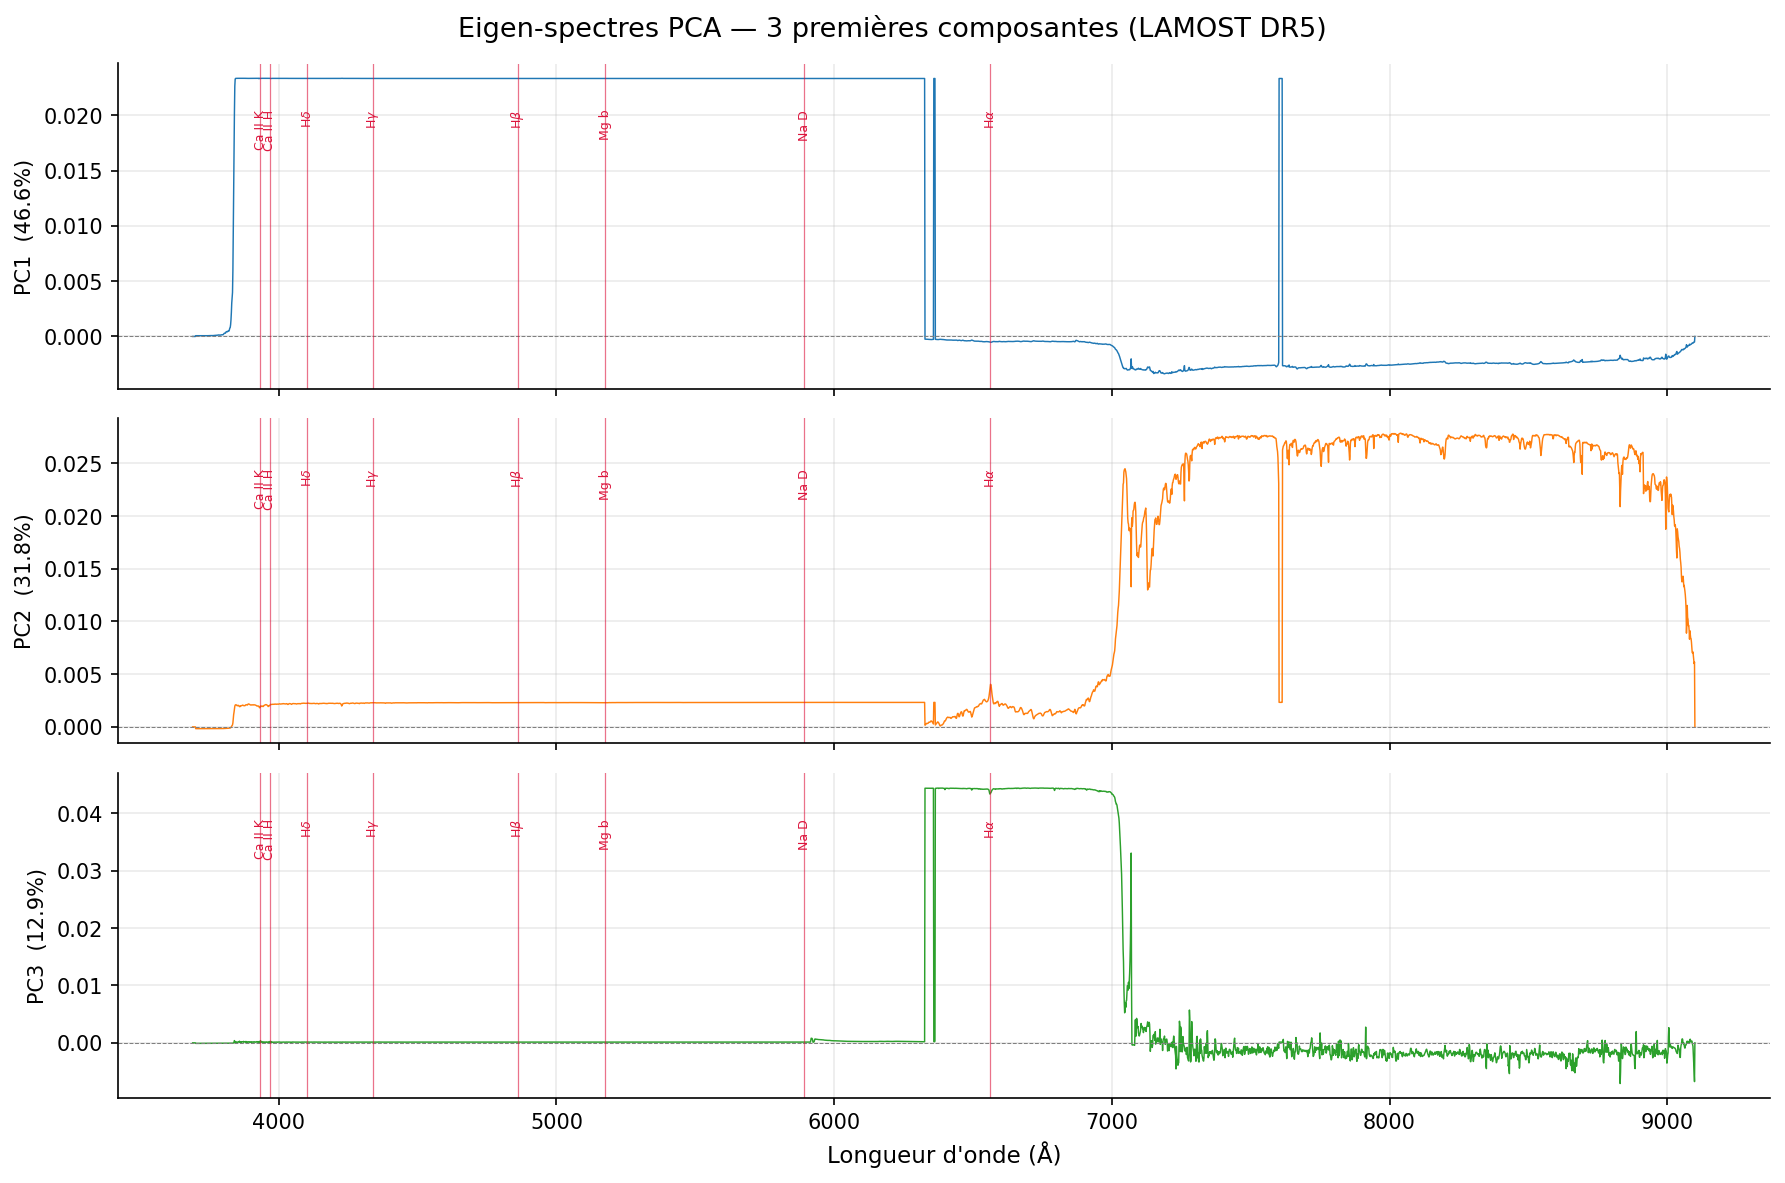
Eigenspectra on raw flux (10,000 spectra, 3,921 channels): Three components are sufficient to explain 91.3% of raw flux variance (vs 91 components for the 183 features). PC1_flux = colour slope (Teff) · PC2_flux = infrared rise cool stars · PC3_flux = blue/red instrumental cut.
For the complete interpretation, see Physical interpretation of PCA.
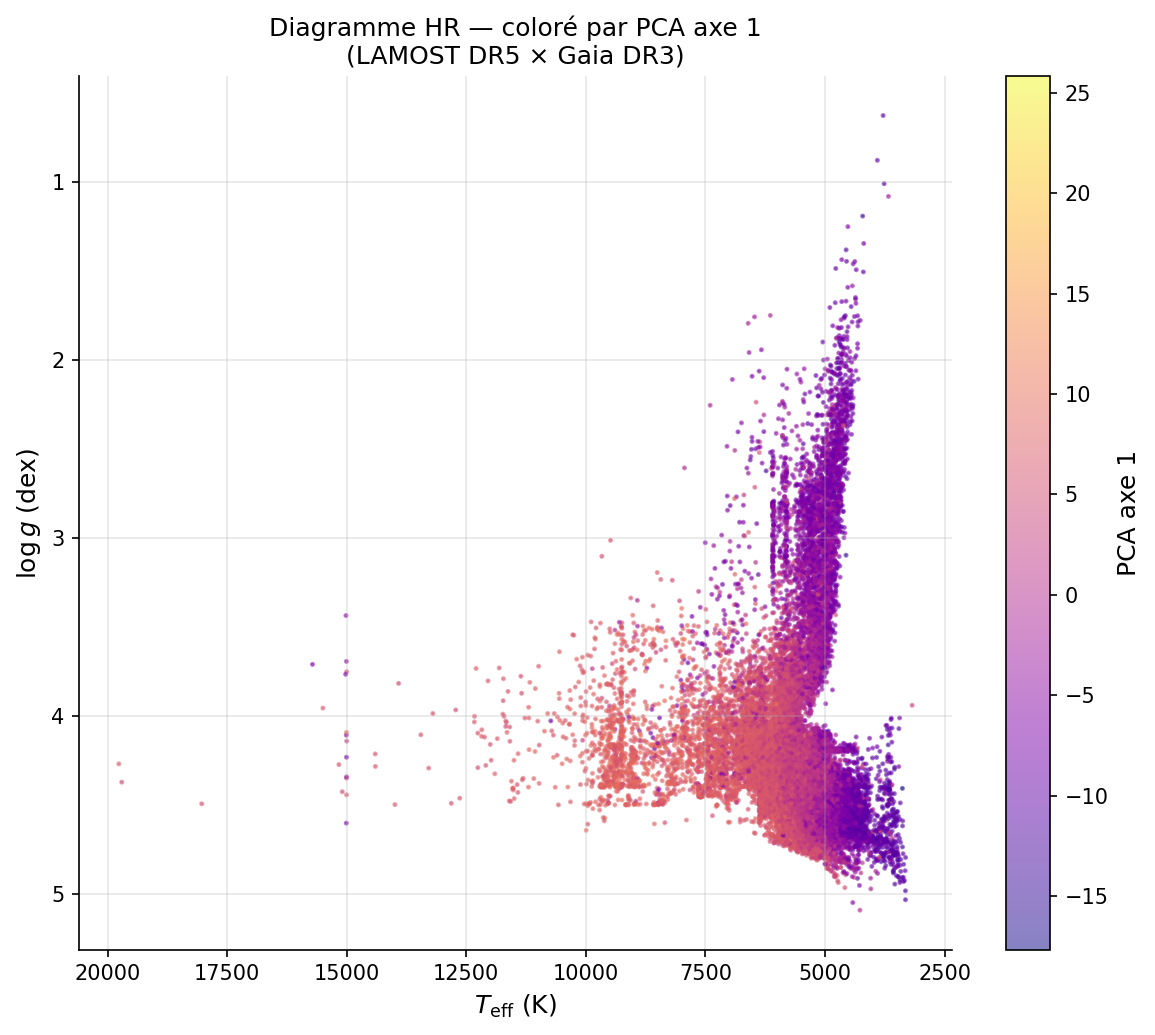
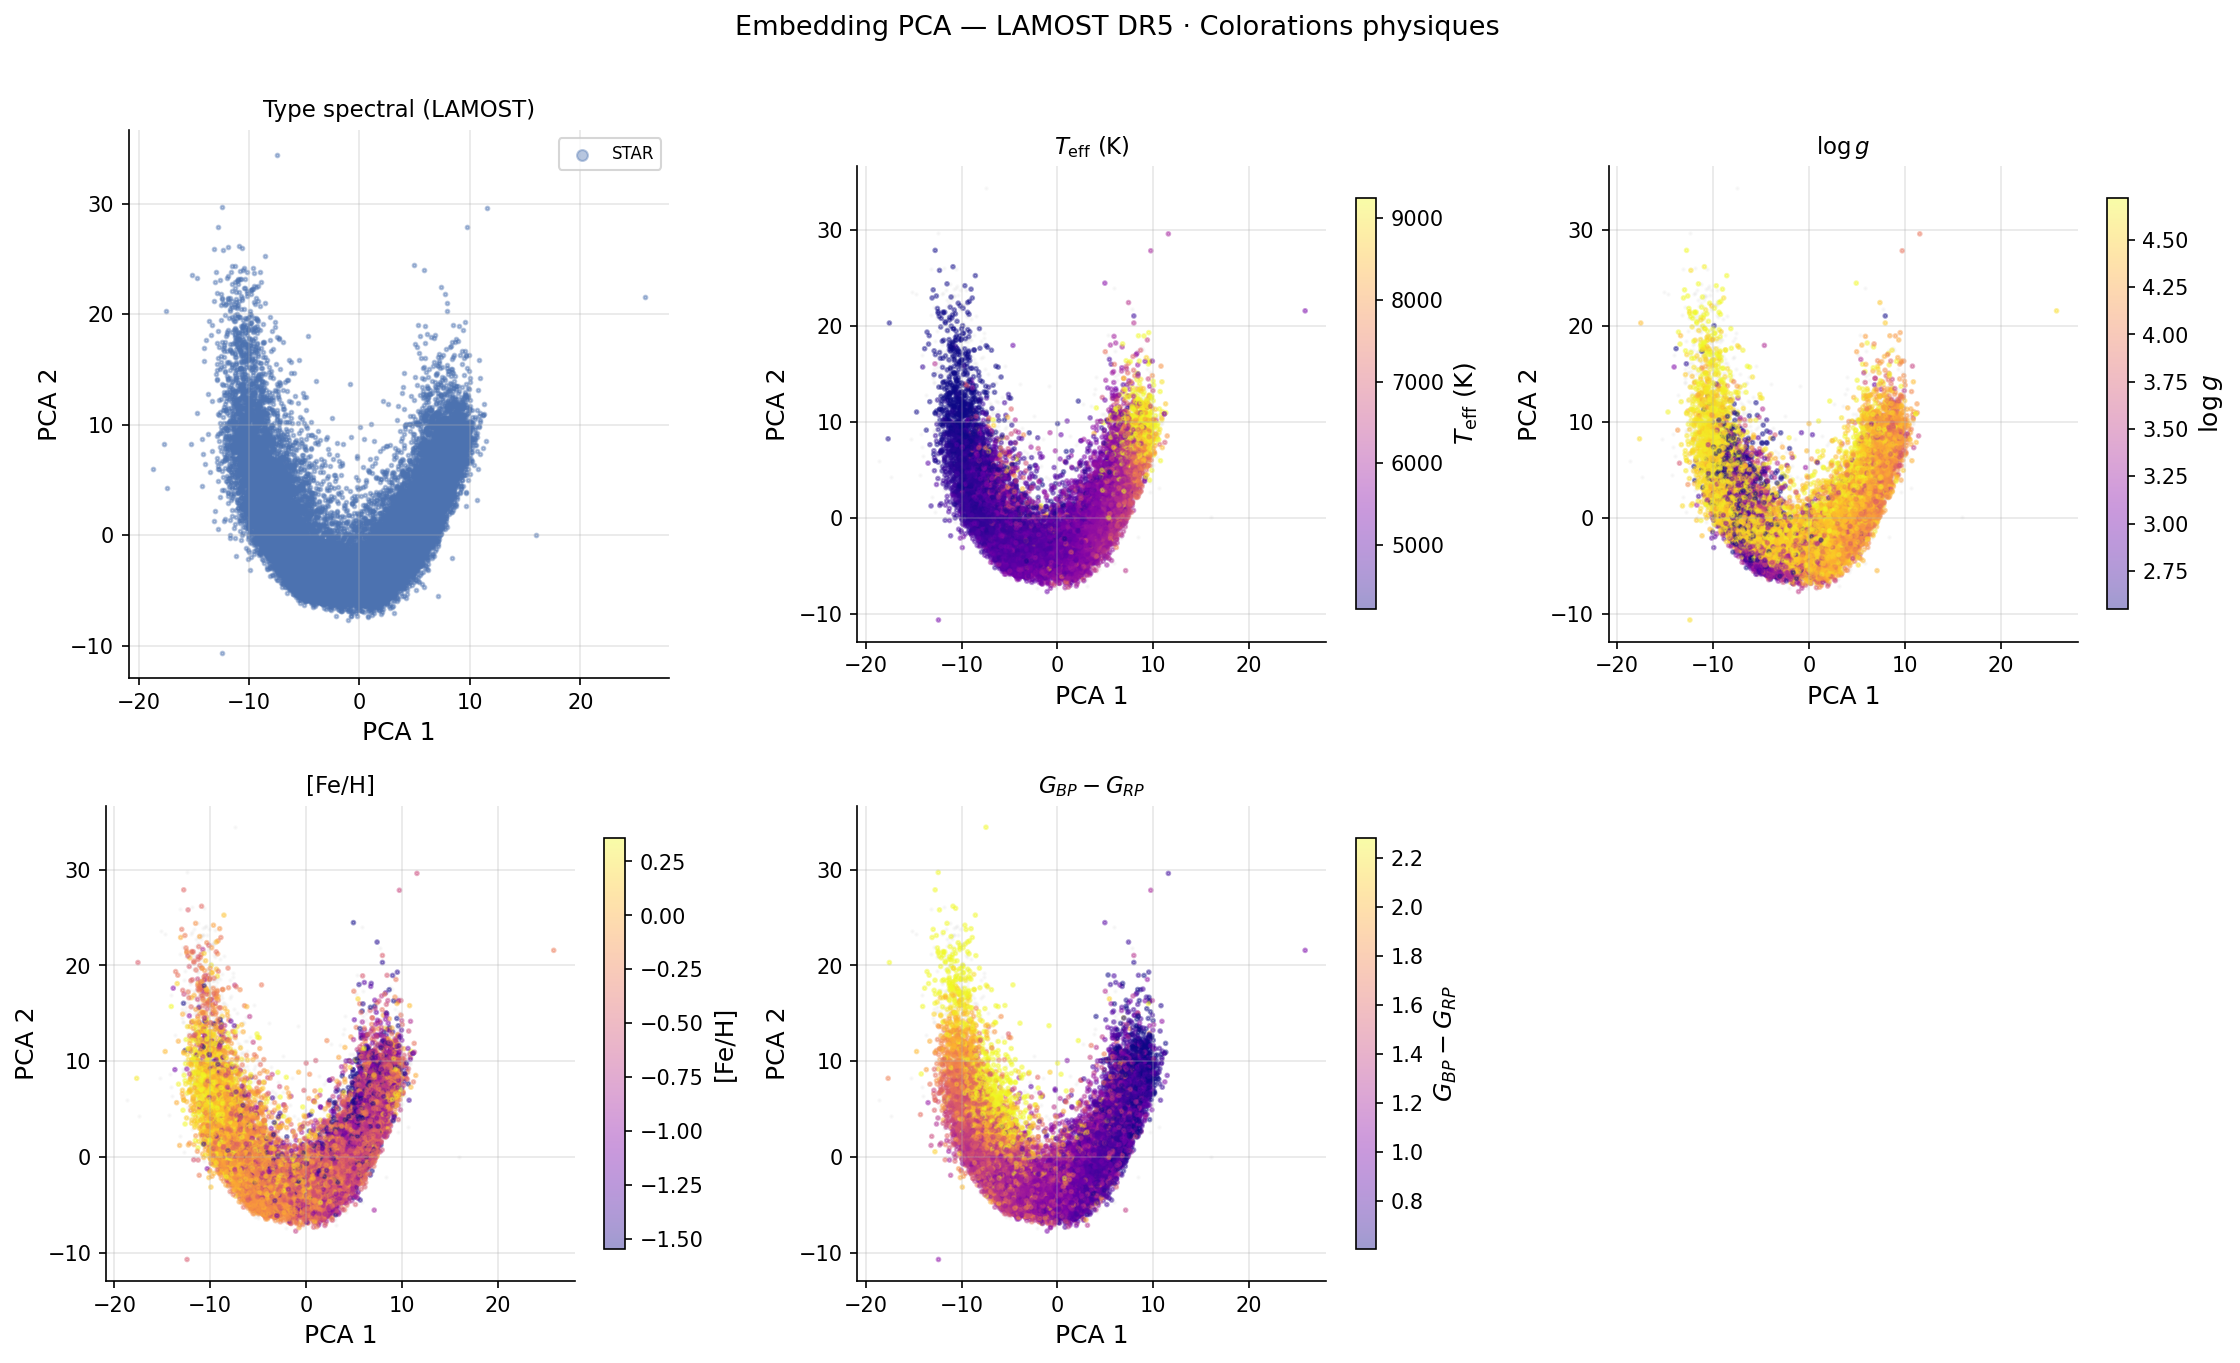
UMAP — Topological structure and HDBSCAN clusters
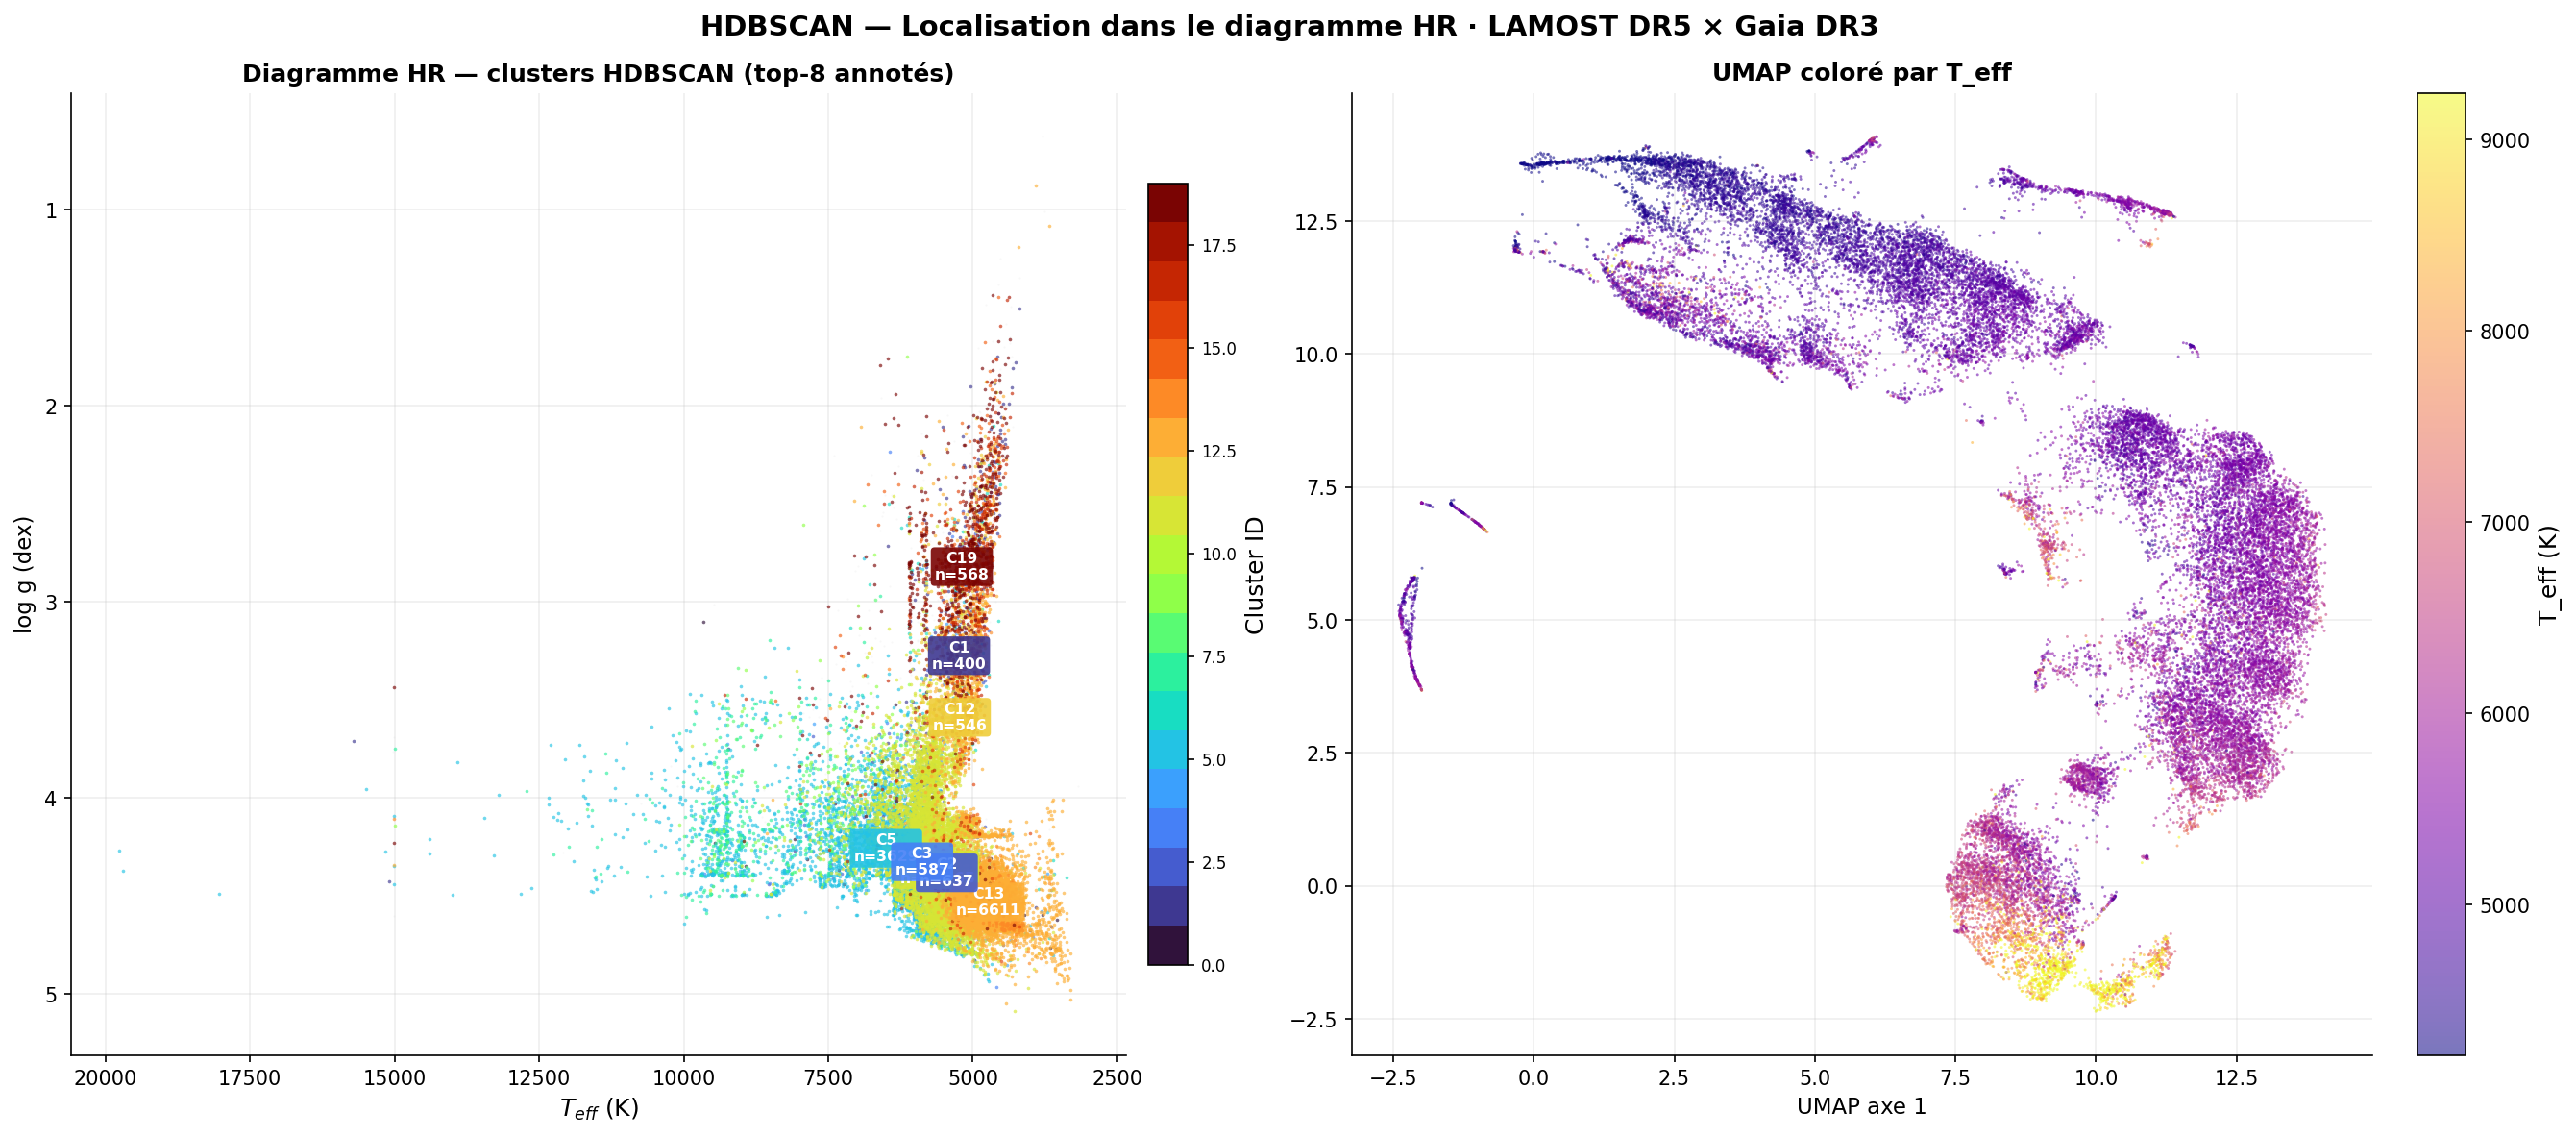
UMAP is applied to the 91 PCA components with n_neighbors=15, min_dist=0.1, 200 epochs (t = 40.1 s, Ryzen 9 5950X). The projection reveals a "continuous continent" structure where the Harvard sequence (M-K-G-F-A) unfolds without supervision.
Correlations: ρ(UMAP axis 1, Teff) = +0.464. The luminosity class (dwarfs vs giants) induces a visible topological bifurcation when coloured by log g.
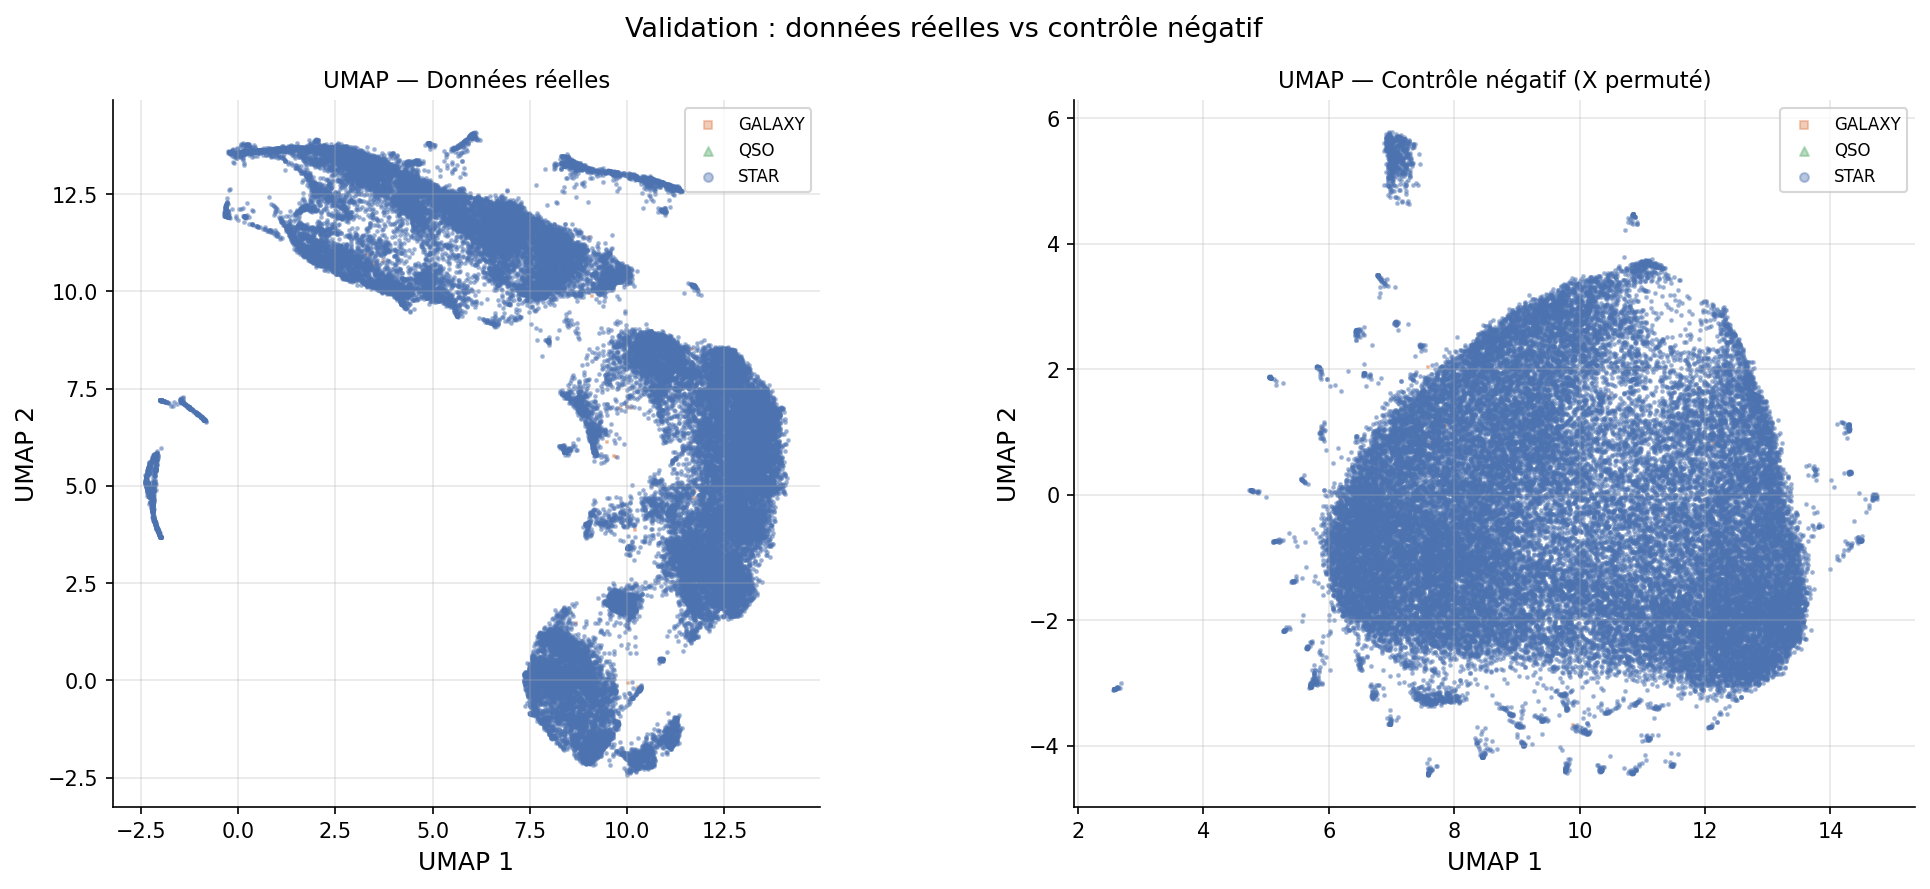
Negative control: UMAP applied to data with randomly permuted columns → compact homogeneous cloud with no structure. The observed structure is of physical origin, not an algorithmic artefact.
HDBSCAN clusters — 20 groups without any label
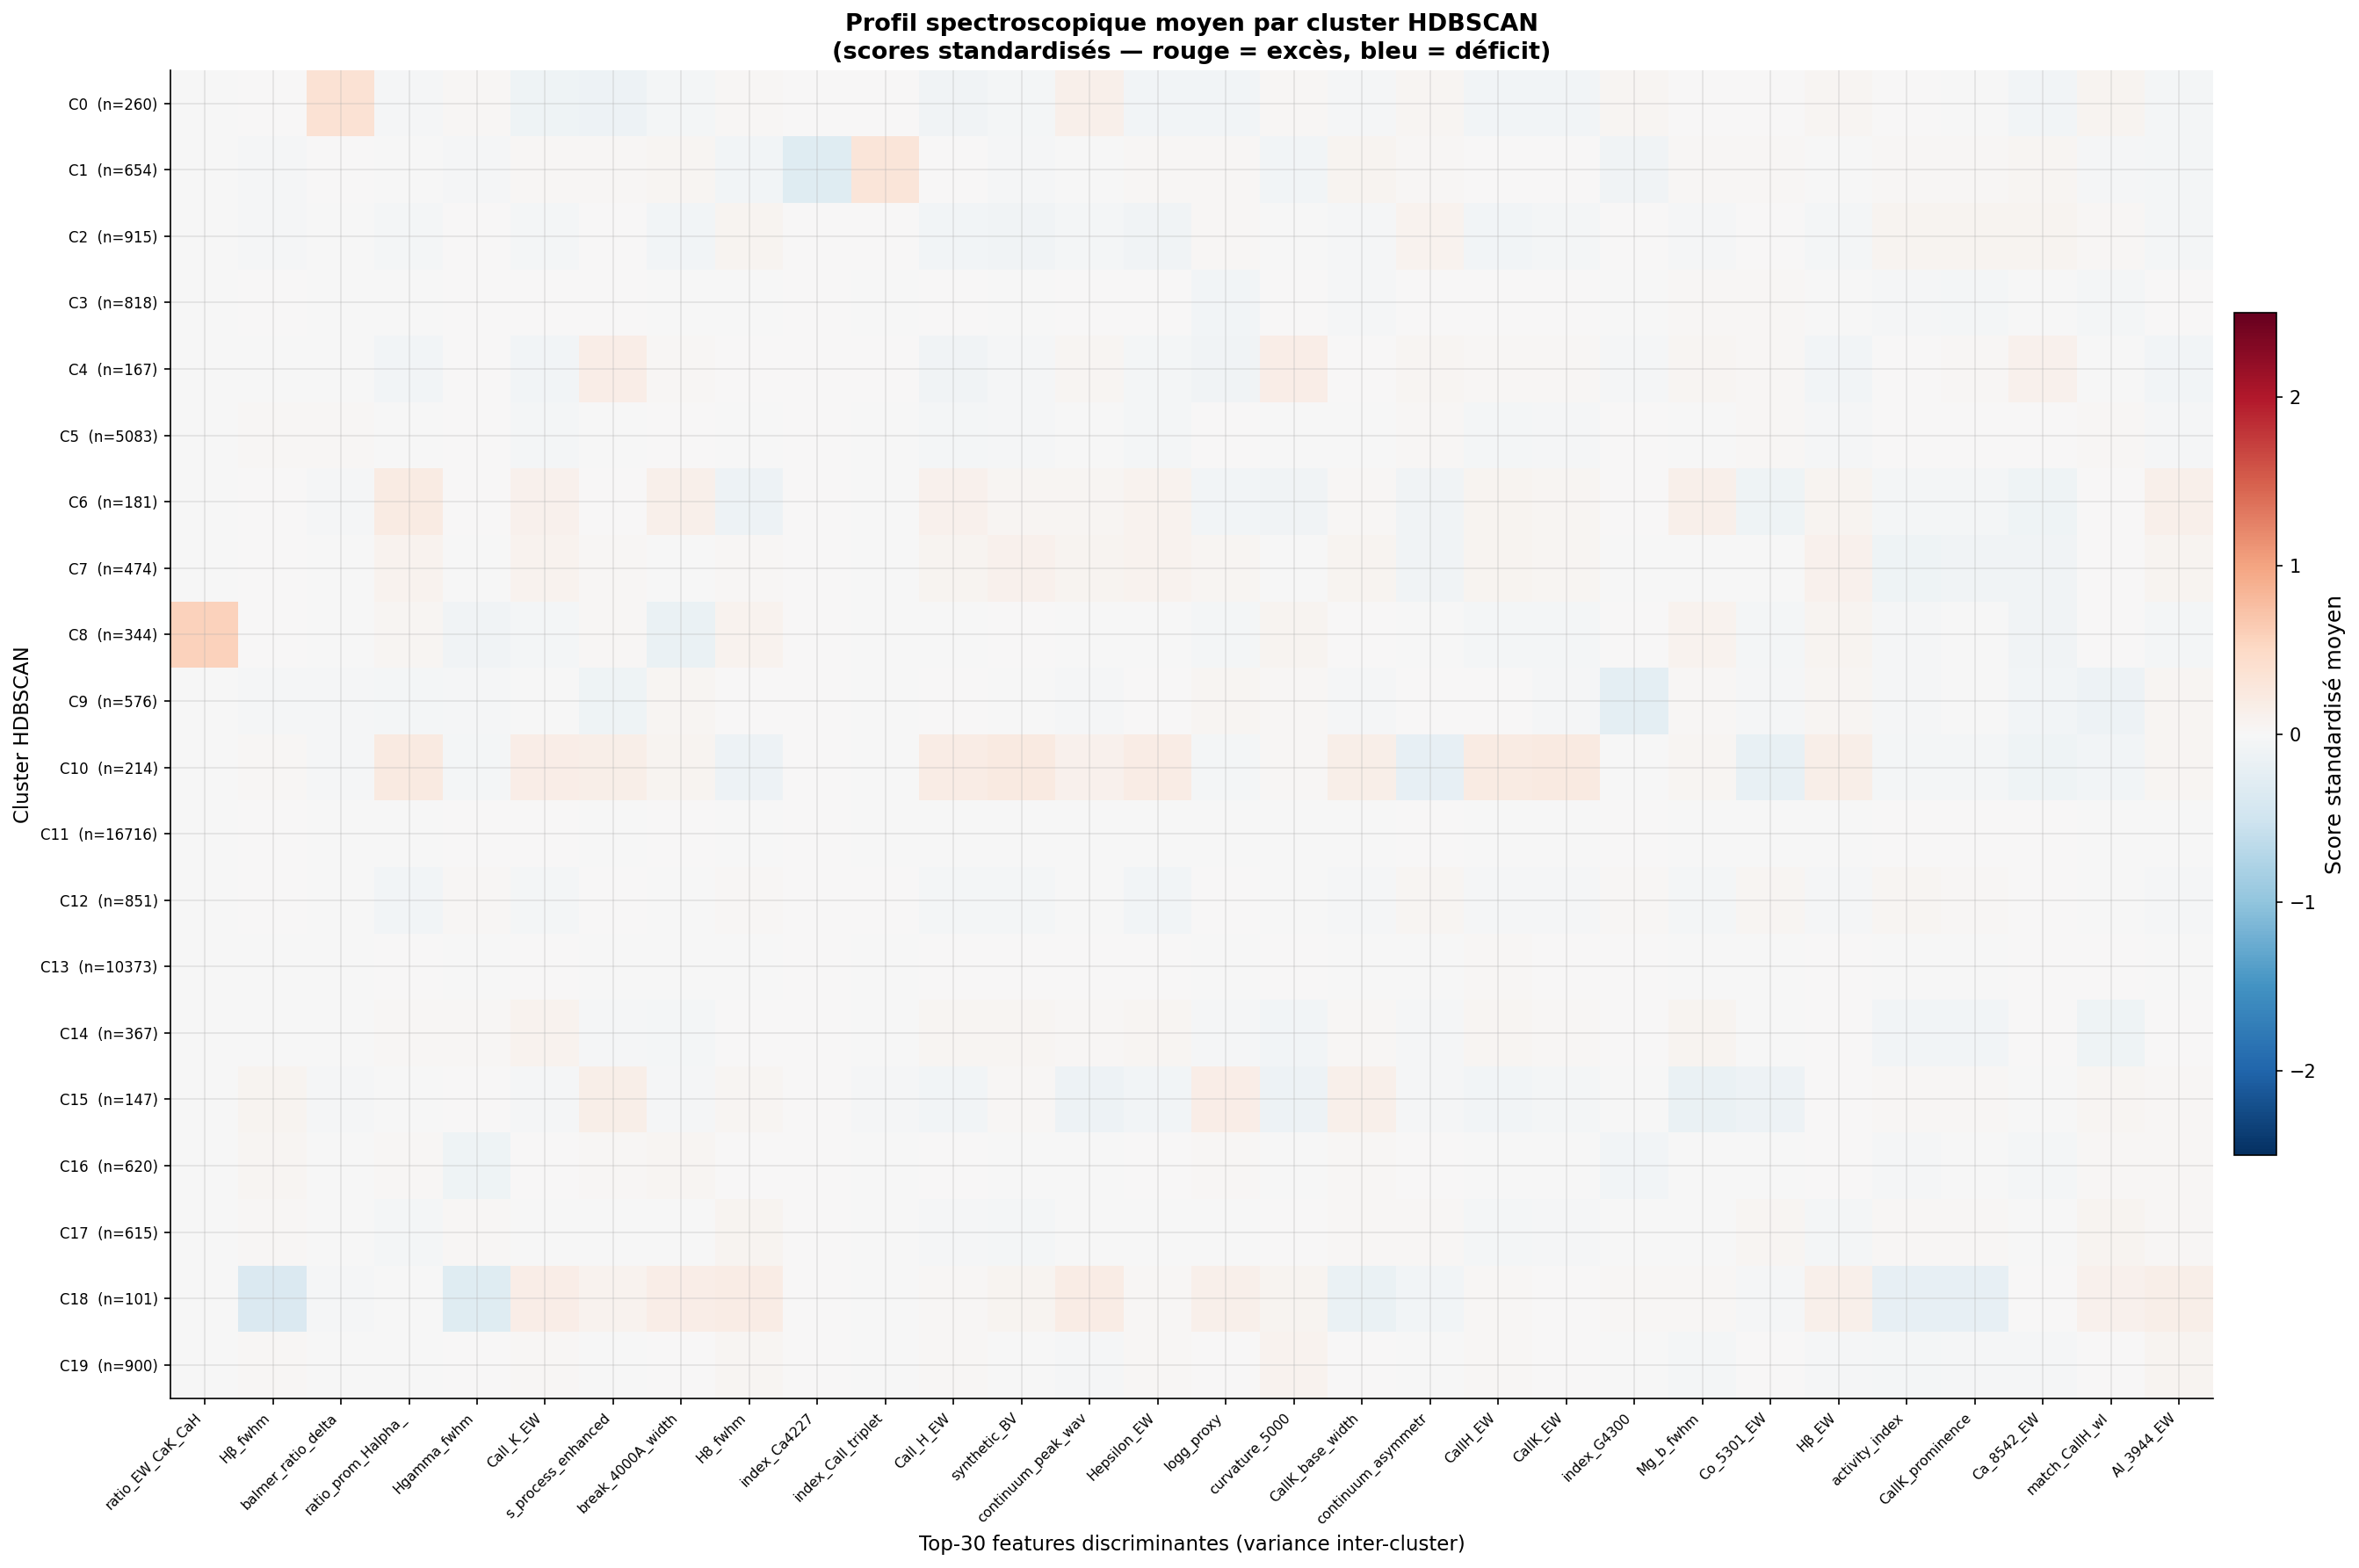
Without any label or log g information, UMAP organises spectra such that HDBSCAN recovers the dwarf/subgiant distinction at fixed Teff. Clusters C19, C1 and C12 are spectrally distinguished by strengthened Ca II lines and weakened Balmer lines — the signature of lower radiation pressure at giant surfaces.
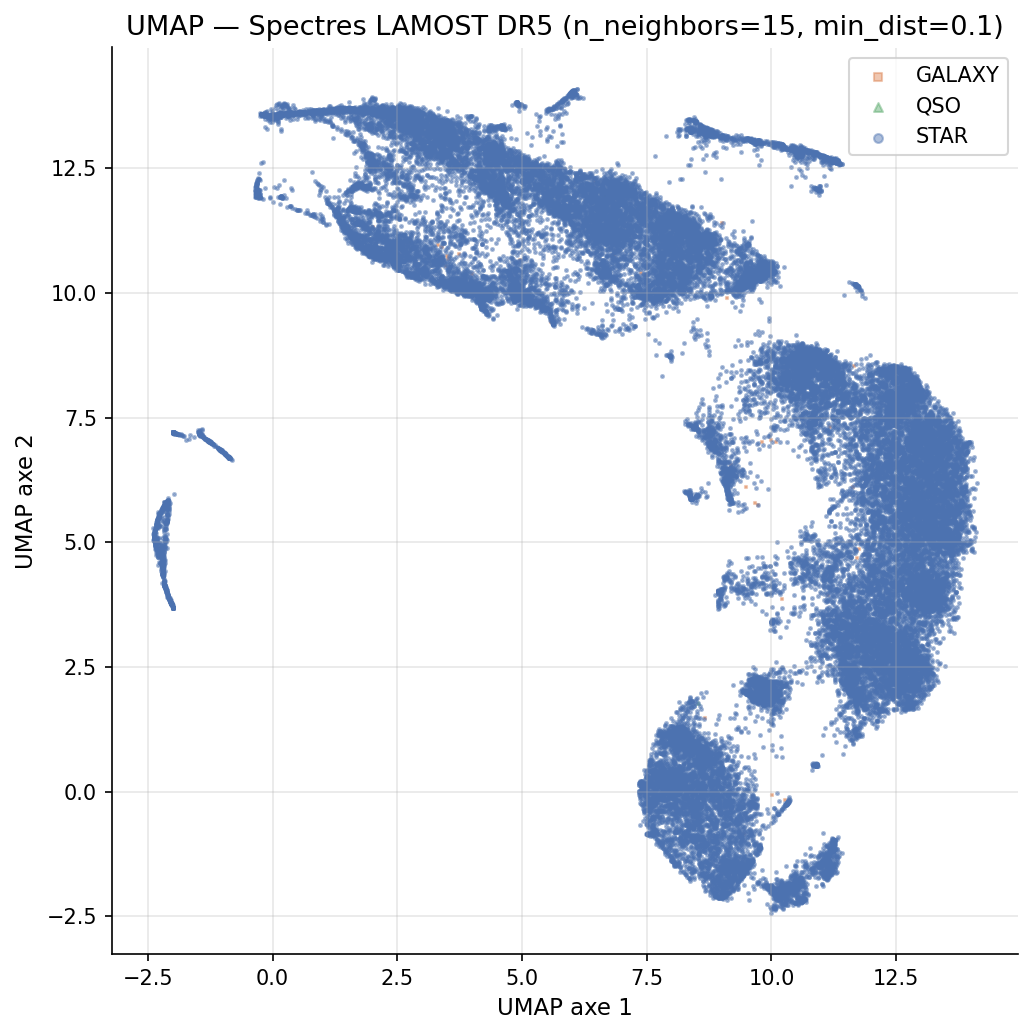
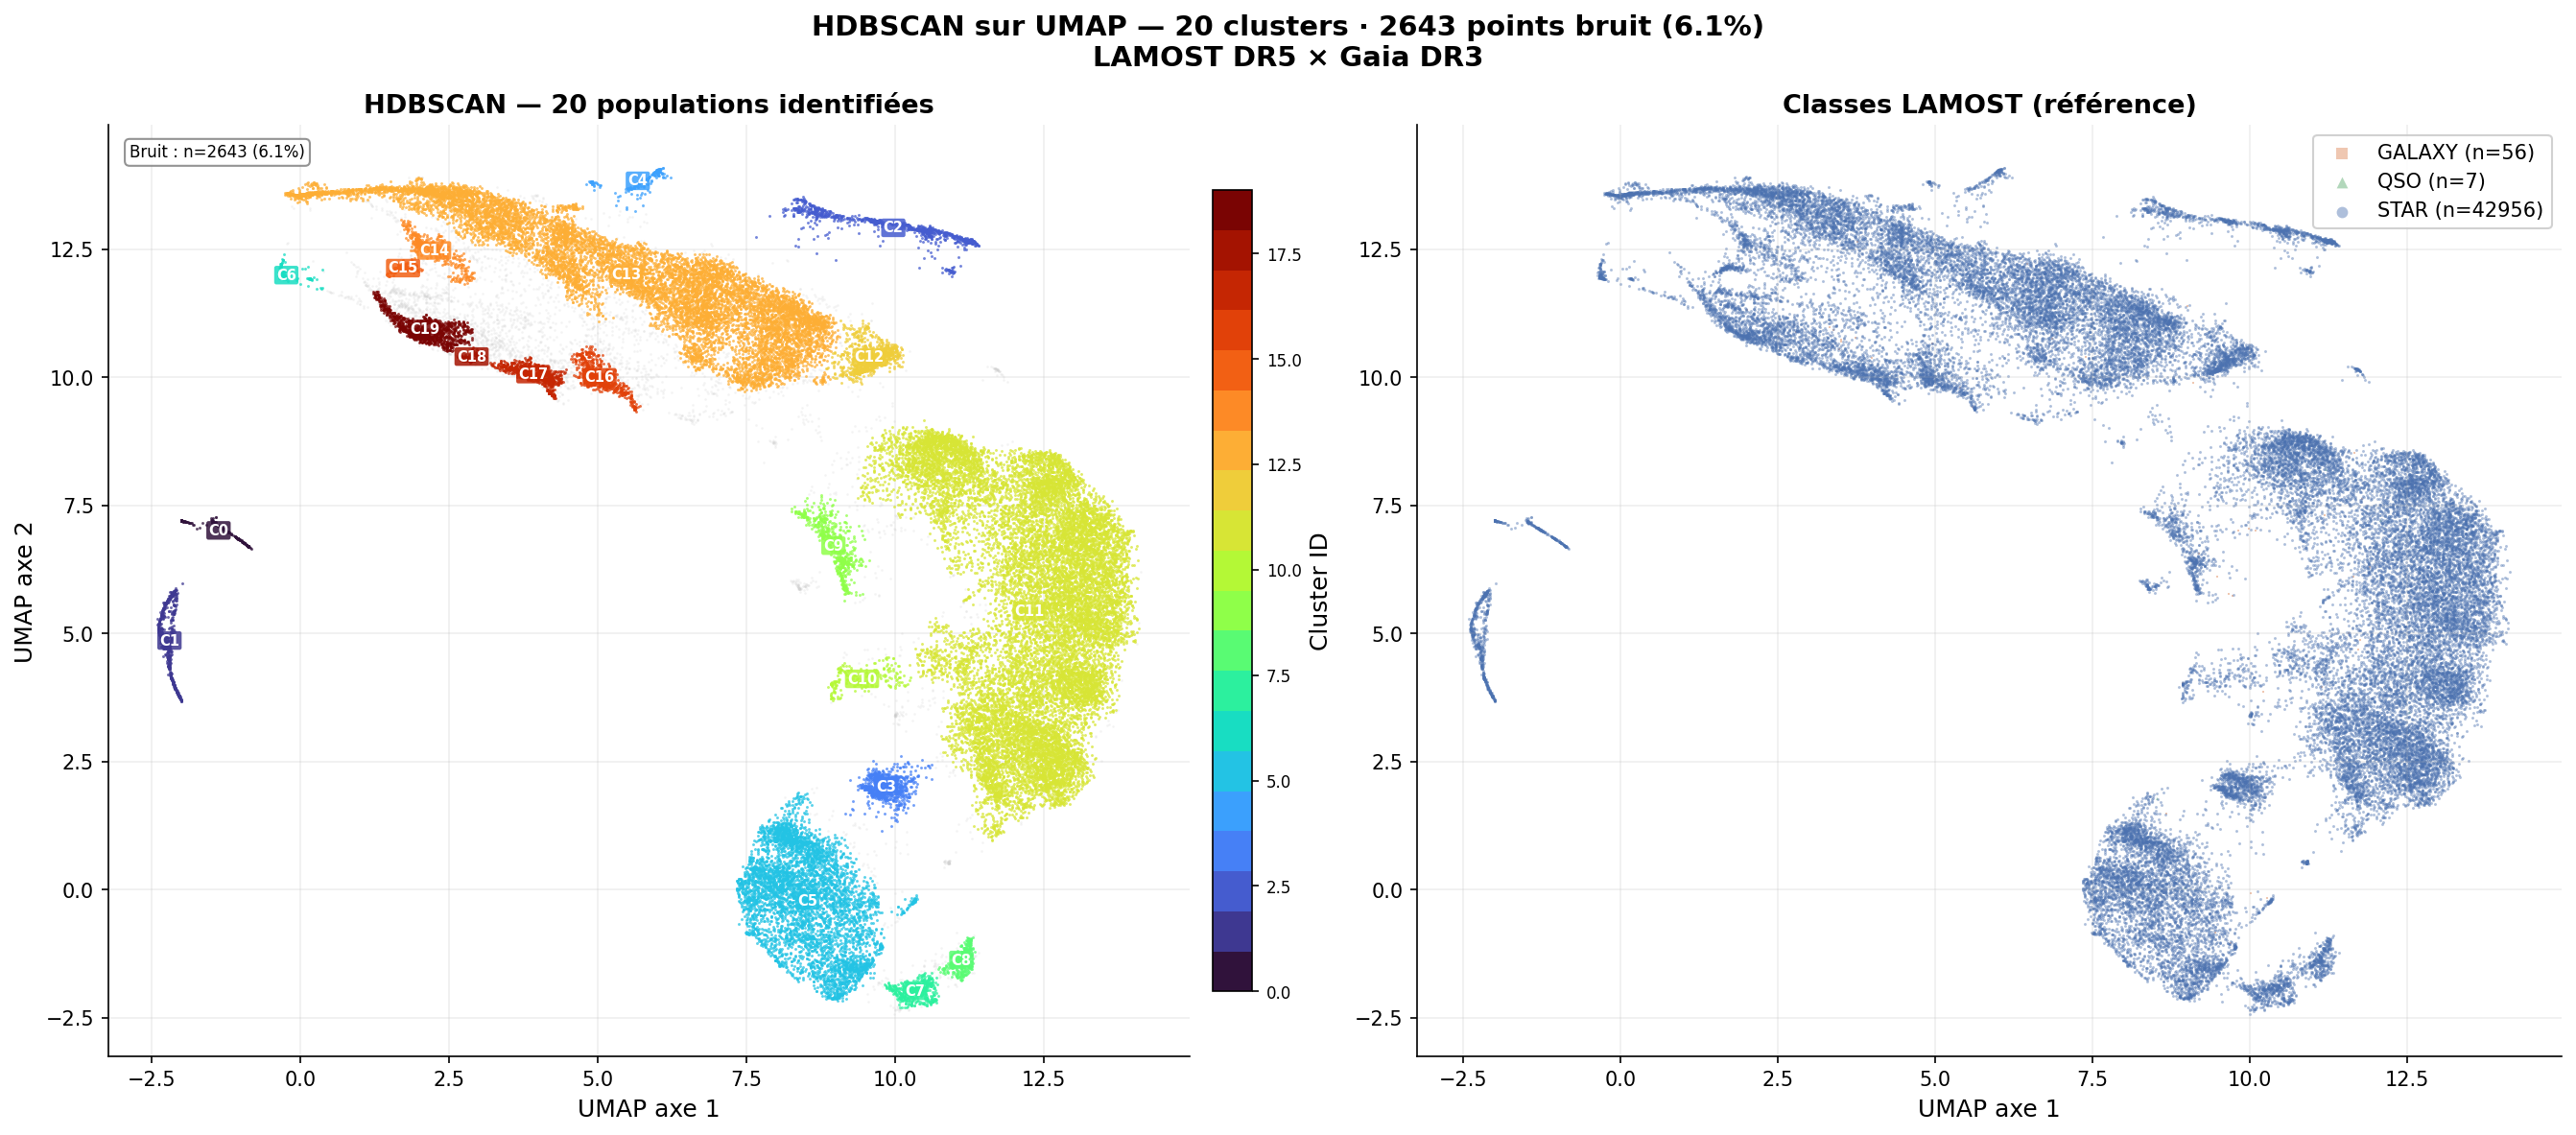
t-SNE — Probabilistic structure and stability
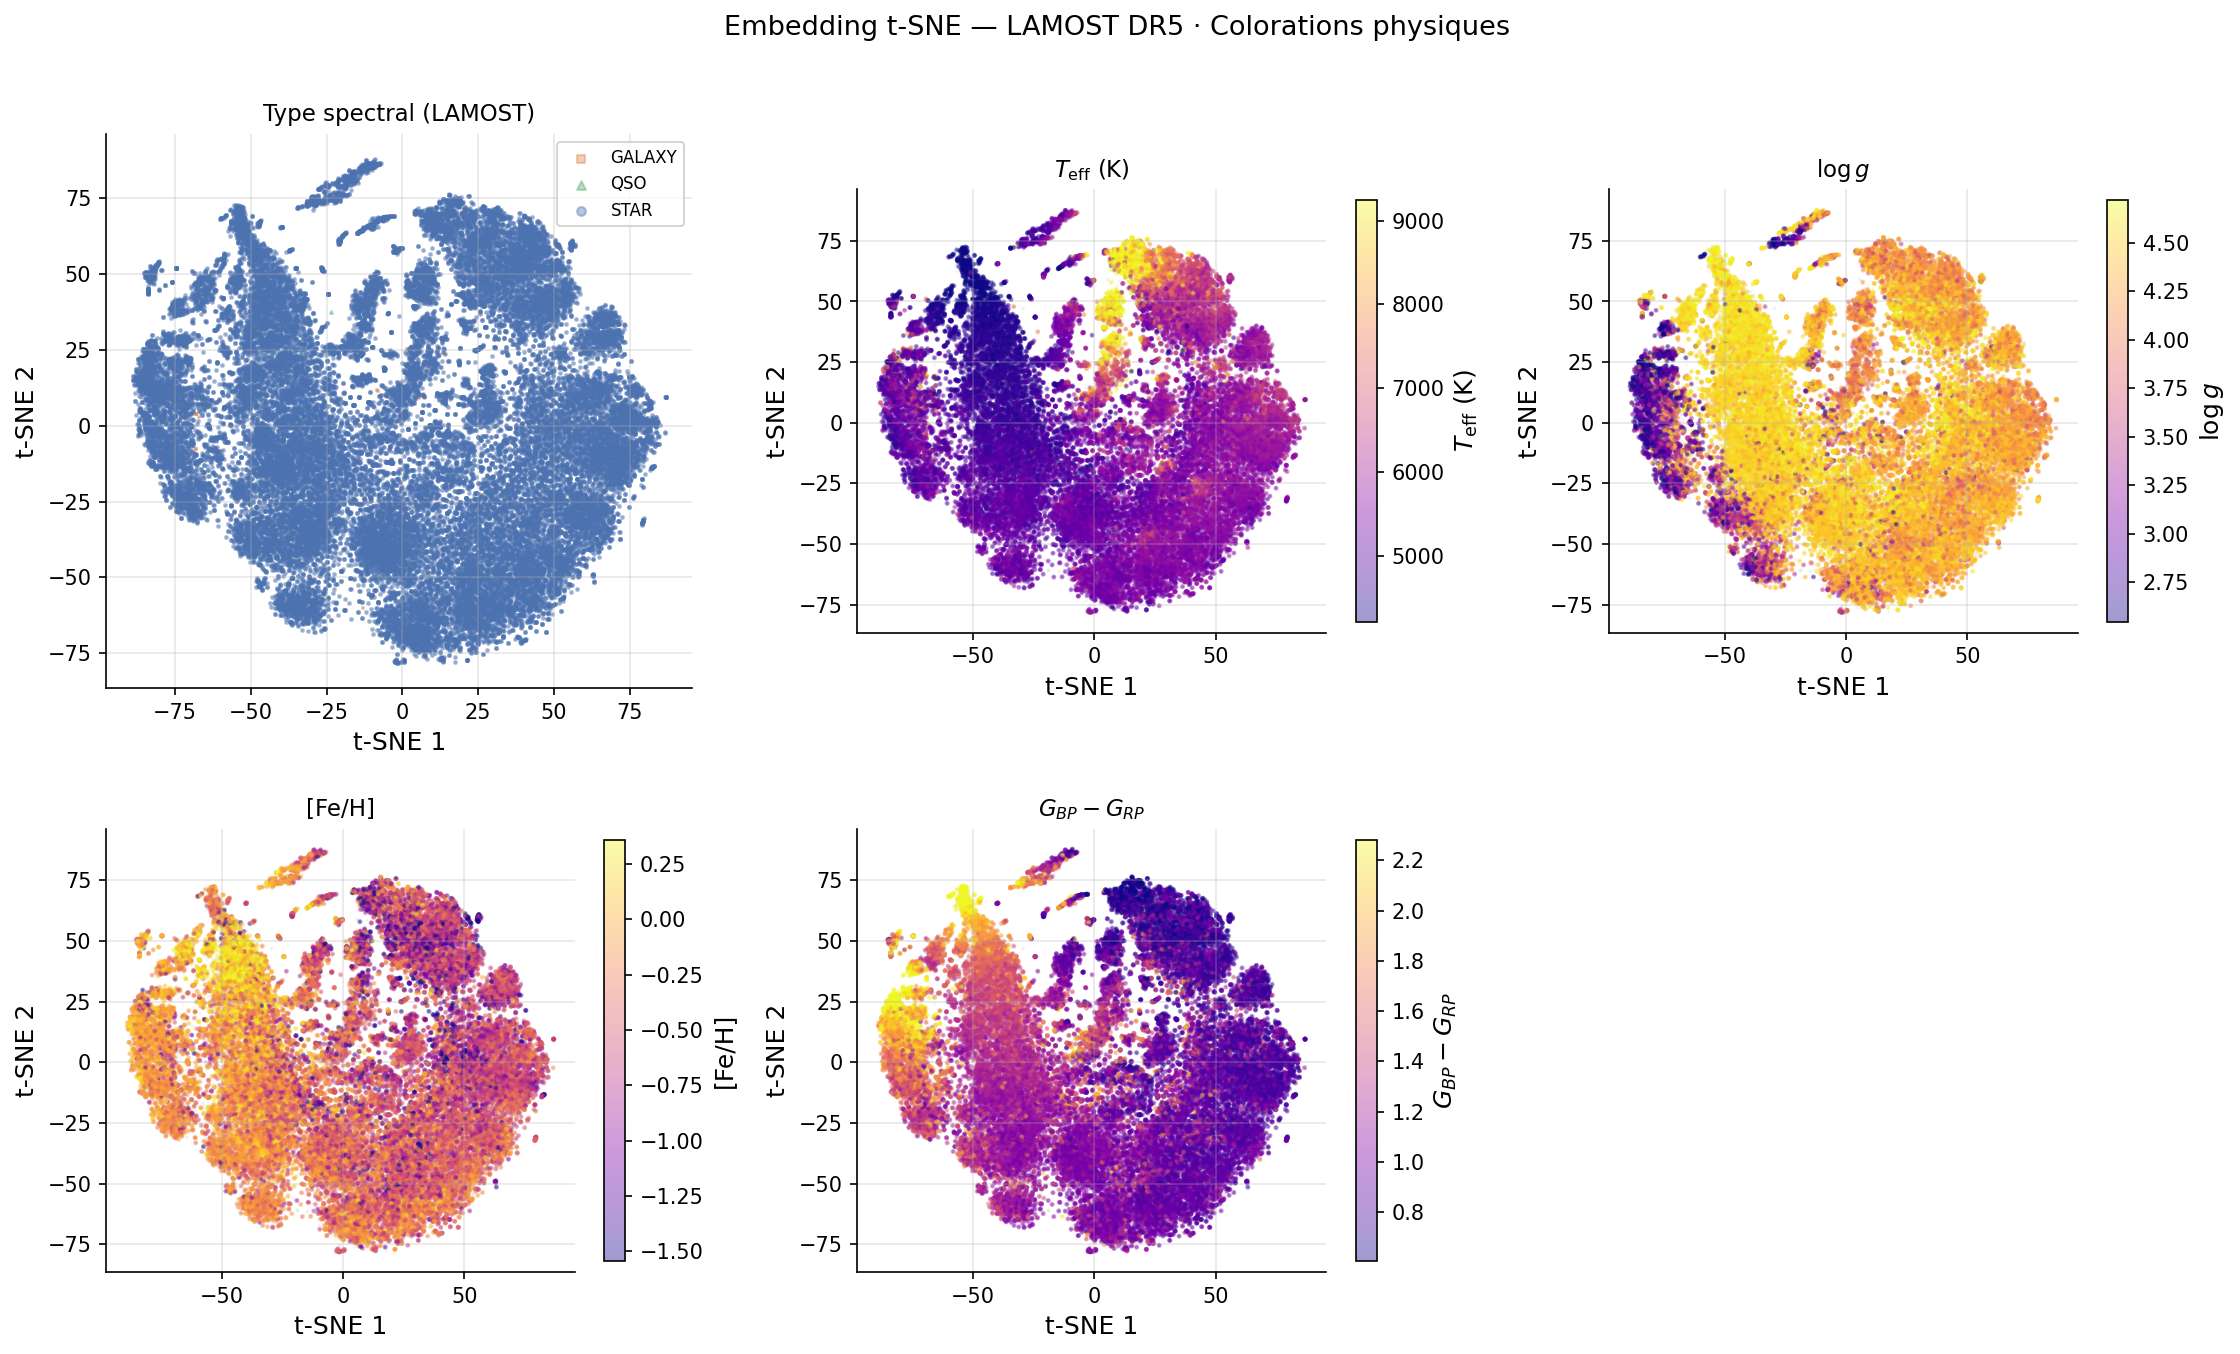
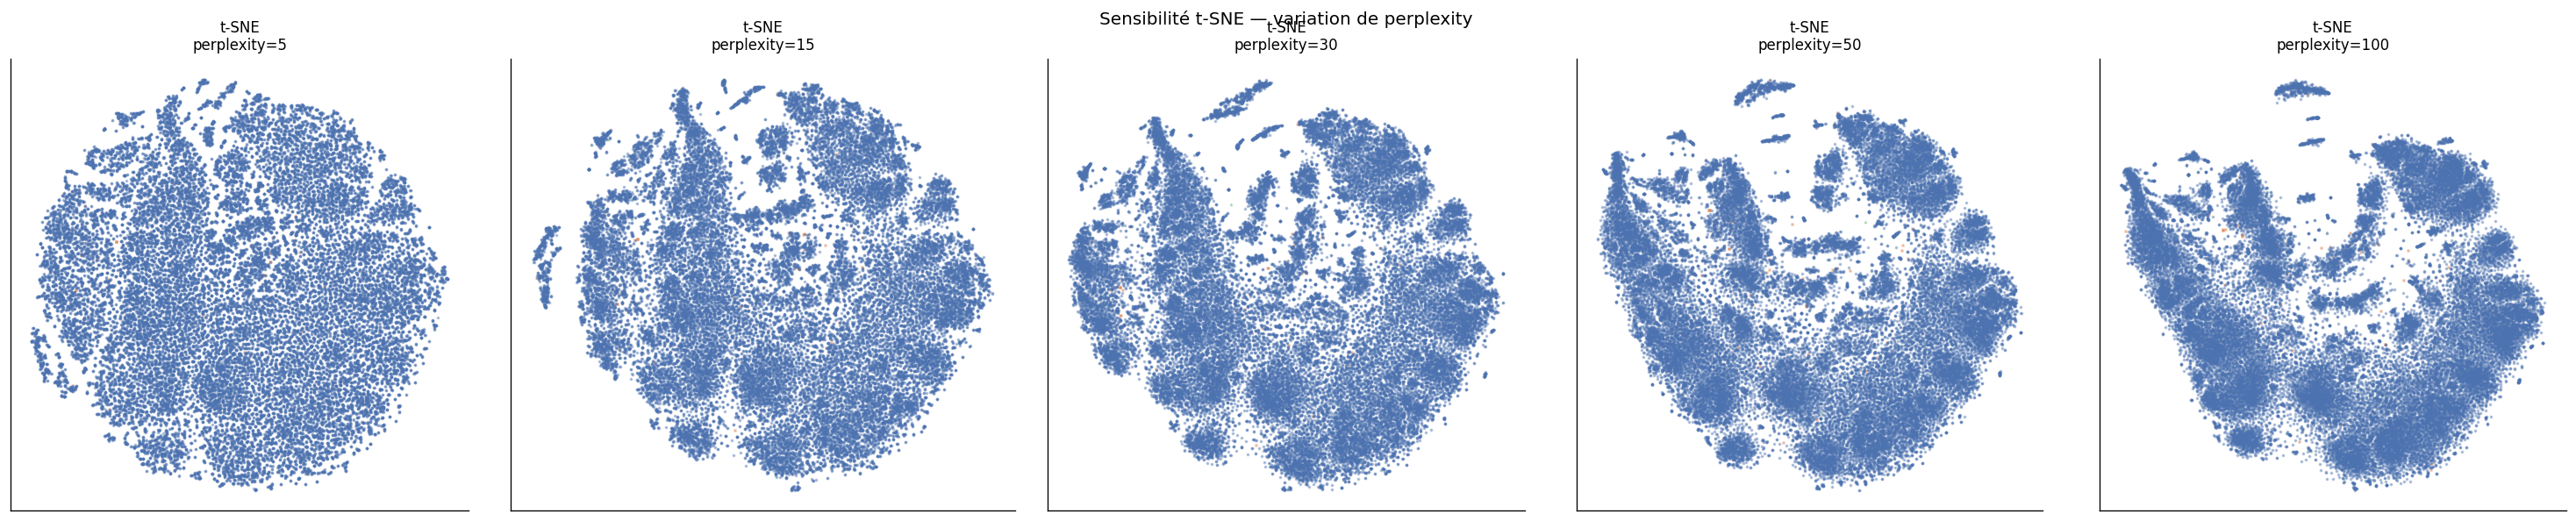
t-SNE is applied to the same 91 PCA components with perplexity=30, init='pca', 1,000 iterations (t = 80.2 s, i.e. 2× UMAP). The projection produces an "archipelago" of compact separated masses, opposite to the continuous UMAP structure.
- Hot stars (A-F, Teff > 7,000 K) form a distinct isolated cluster
- The central mass groups K-G main-sequence stars
- Log g colouring reveals partially isolated subgiant clusters
t-SNE excels at sharp separation of discrete sub-populations, while UMAP better preserves continuous gradients (Teff, [Fe/H]).
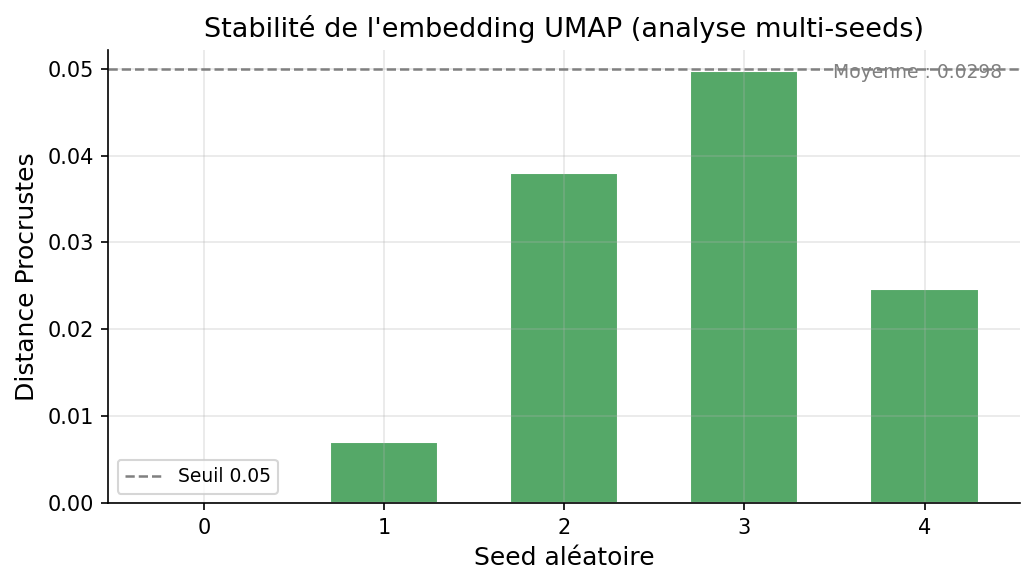
Stability comparison — Procrustes
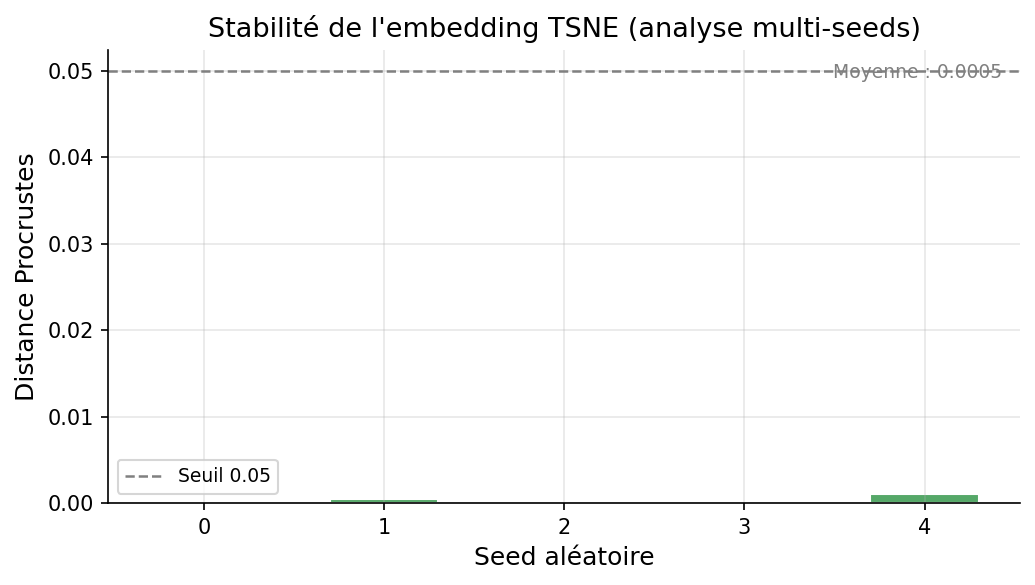
init='pca' fixes an identical starting position. The KL penalty only penalises nearby neighbours — insensitive to the seed for large structures.Comparative synthesis — PCA · UMAP · t-SNE
Axis 2 — Supervised XGBoost classification
G2 · reference run ST_350k_xgb_AFGKM_v6.
Global performance (spectro_only=True mode)
The reference classifier is trained on the 350k-spectrum generation, not on the PHY-3500 dataset: 207 candidate columns, 99 selected features, five types A, F, G, K, M. On its test set it achieves:
Run v6 (ST_350k_xgb_AFGKM_v6) was trained with spectro_only enabled, but its 99 selected features include 4 Gaia/photometric columns (M_G, M_BP, M_RP, ag_gspphot). Its metrics are therefore not purely spectroscopic; see the Data Leakage Audit.
Historical pipeline progression
Supervised / unsupervised coherence
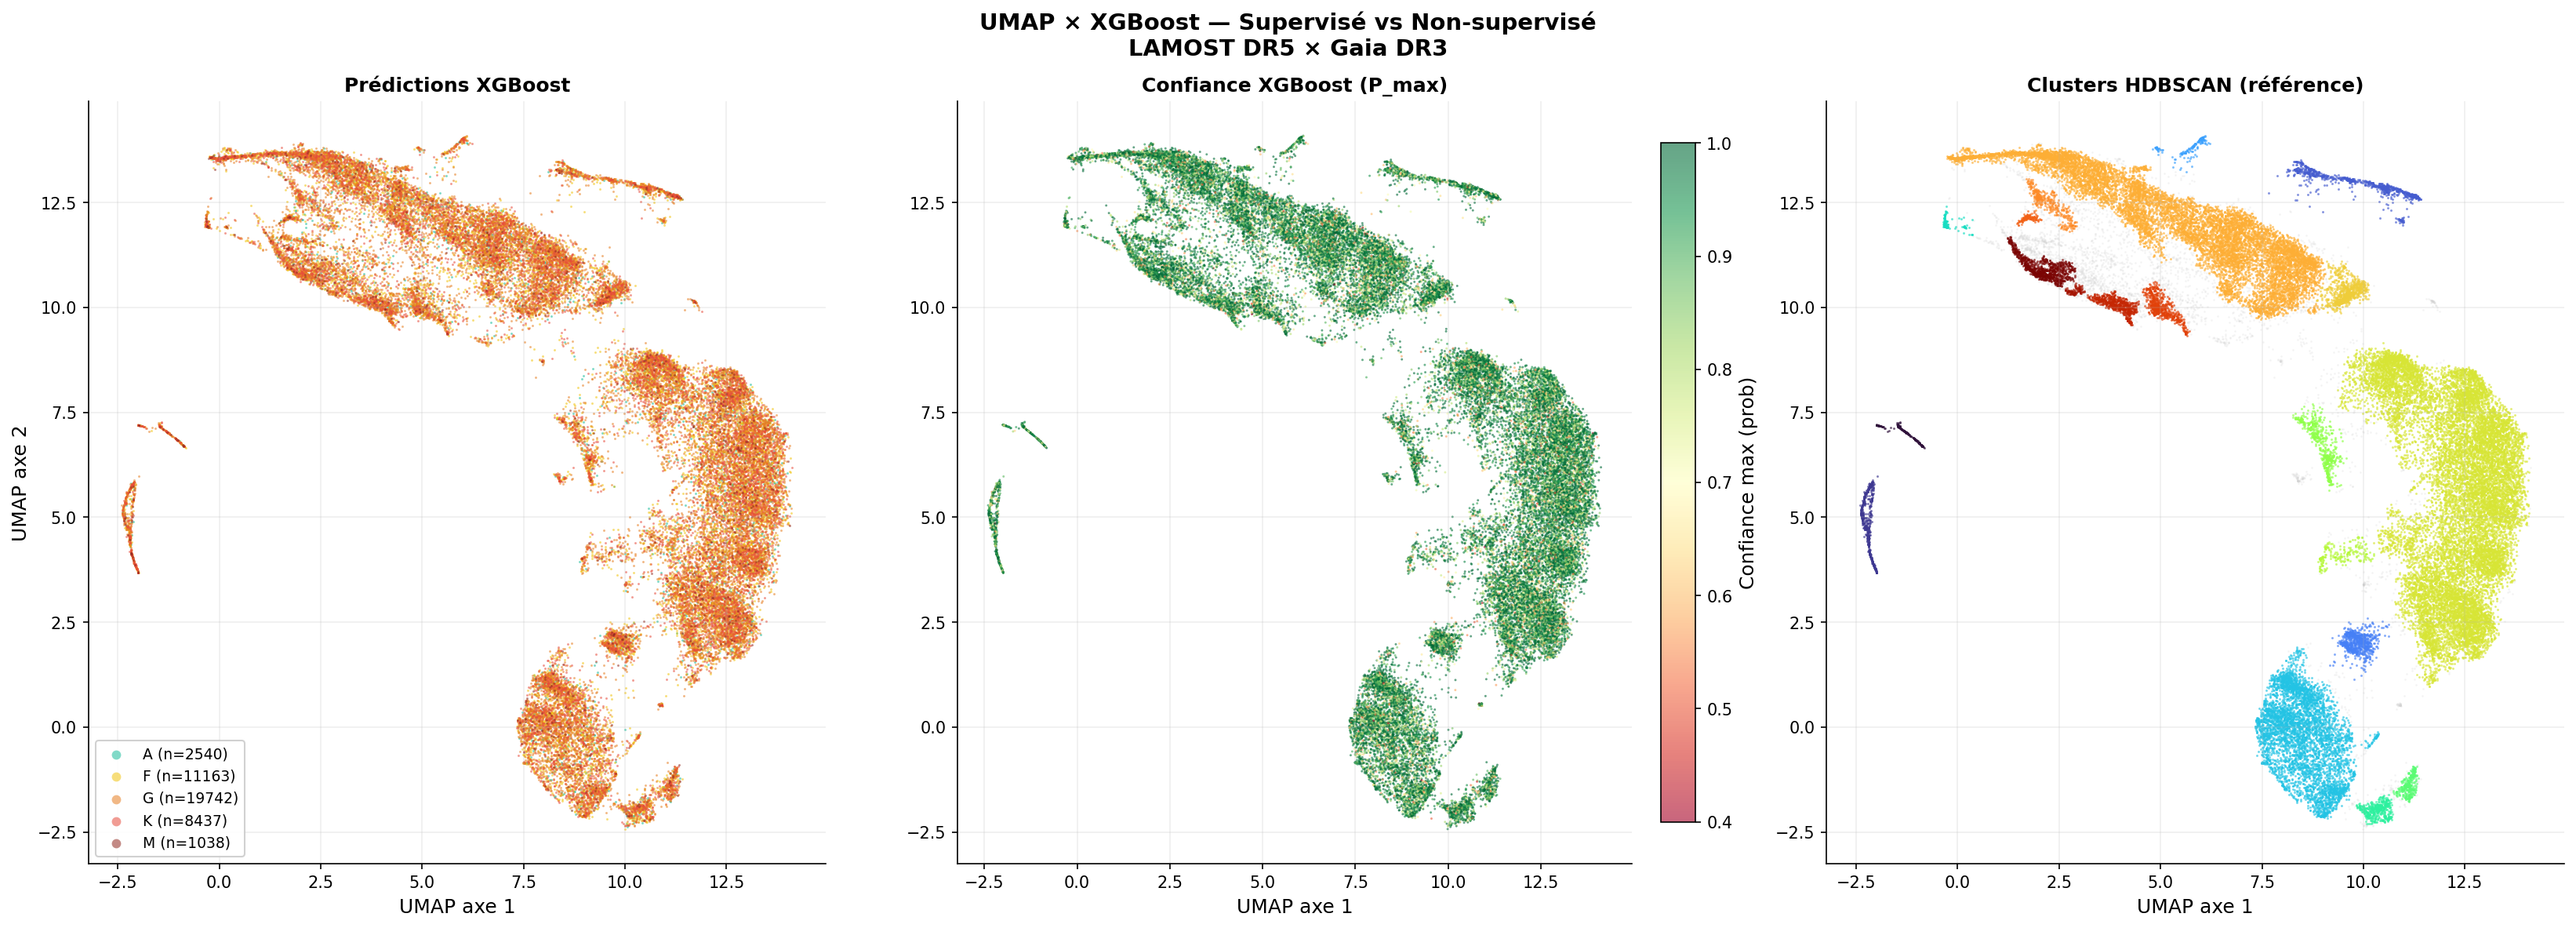
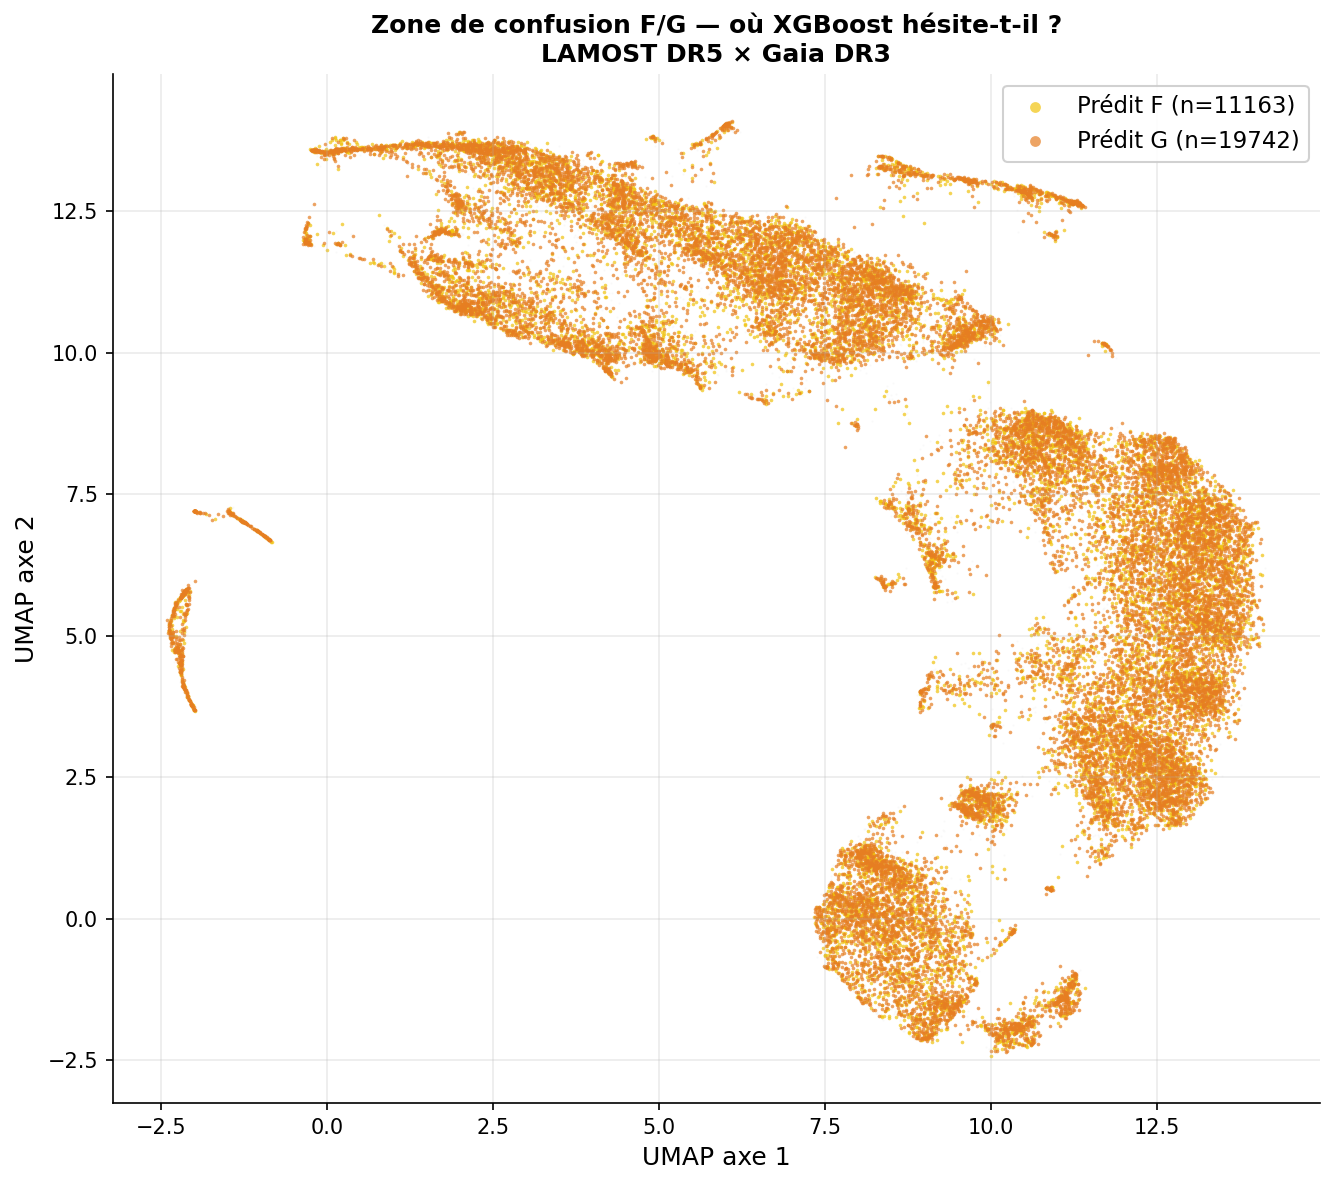
This comparison uses the PHY-3500 UMAP (G1) and the predictions of an earlier model (run v5), not the reference run. The geographic distribution of XGBoost predictions in UMAP space is coherent with the emergent unsupervised structure: A-type stars in a hot "peninsula", G at the centre, K at the cool periphery. Both approaches capture the same physical structure — the UMAP projection is a qualitative validation space for the classifier.
Axis 3 — SHAP validation
Central result
G2 · SHAP of the reference run.
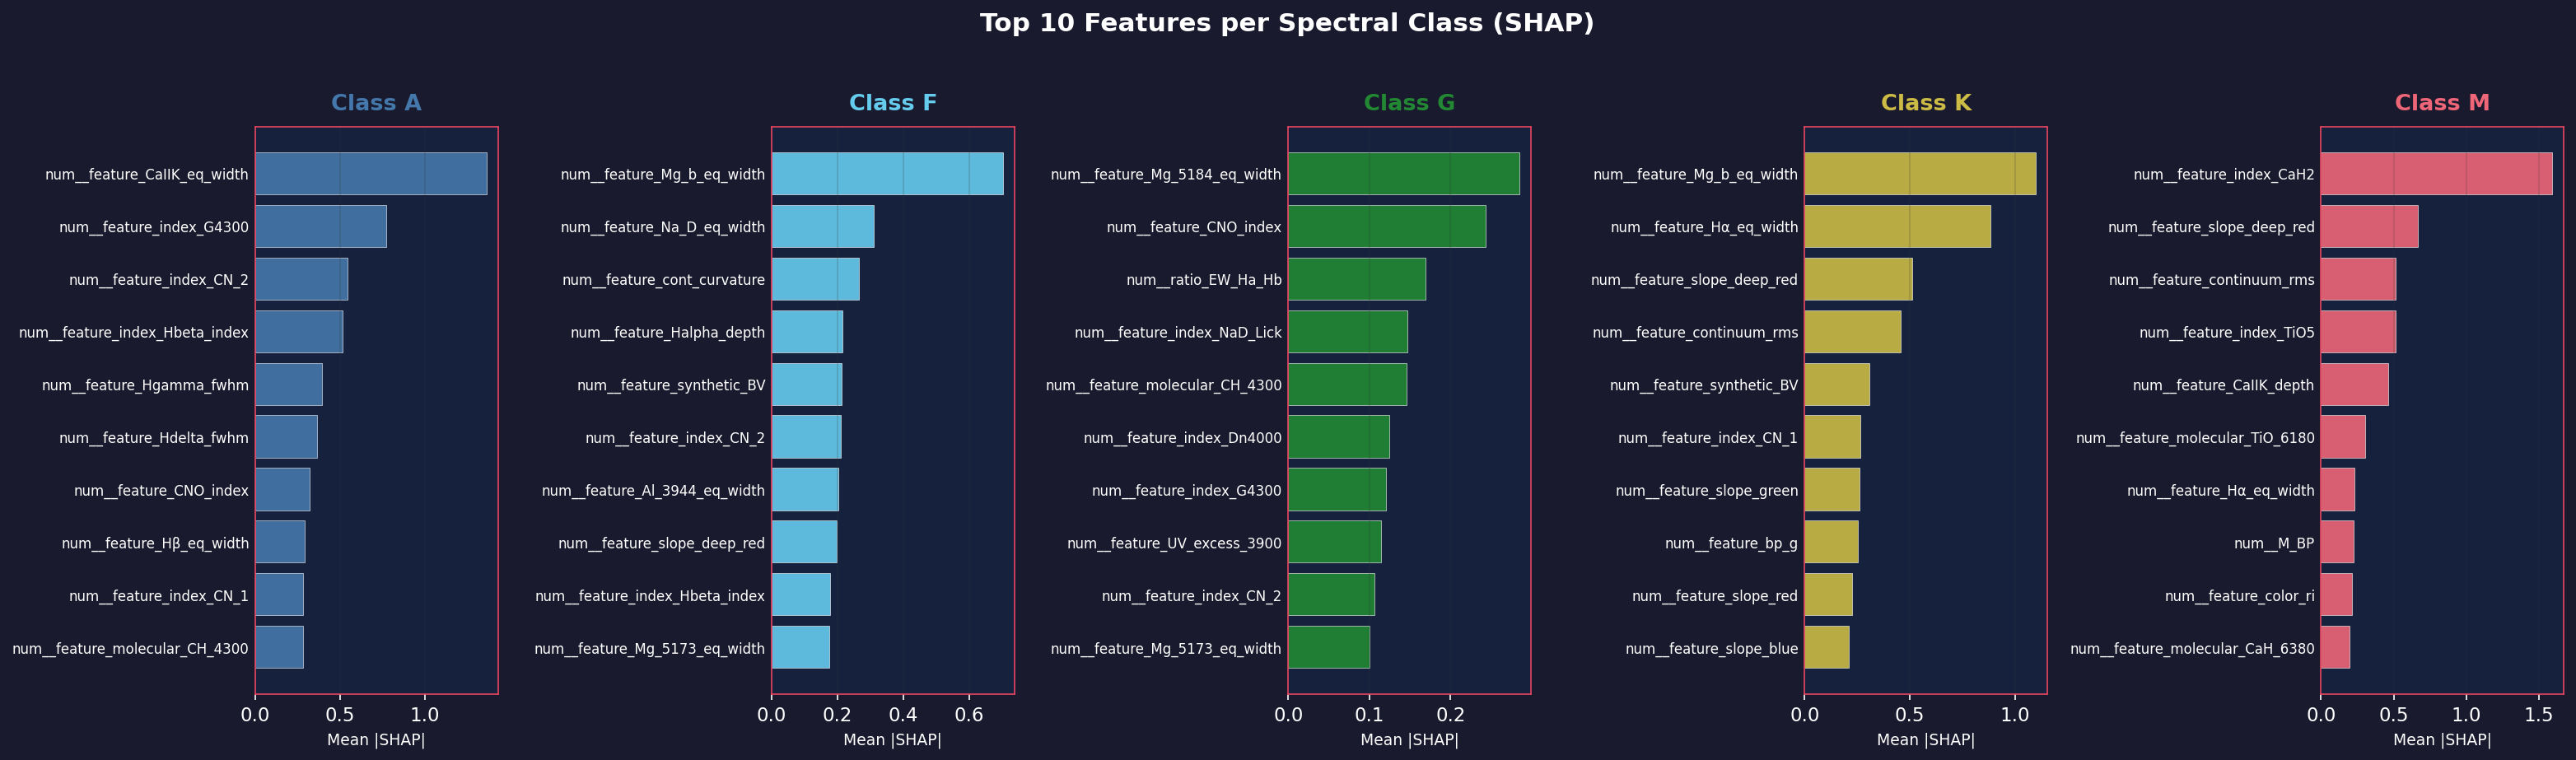
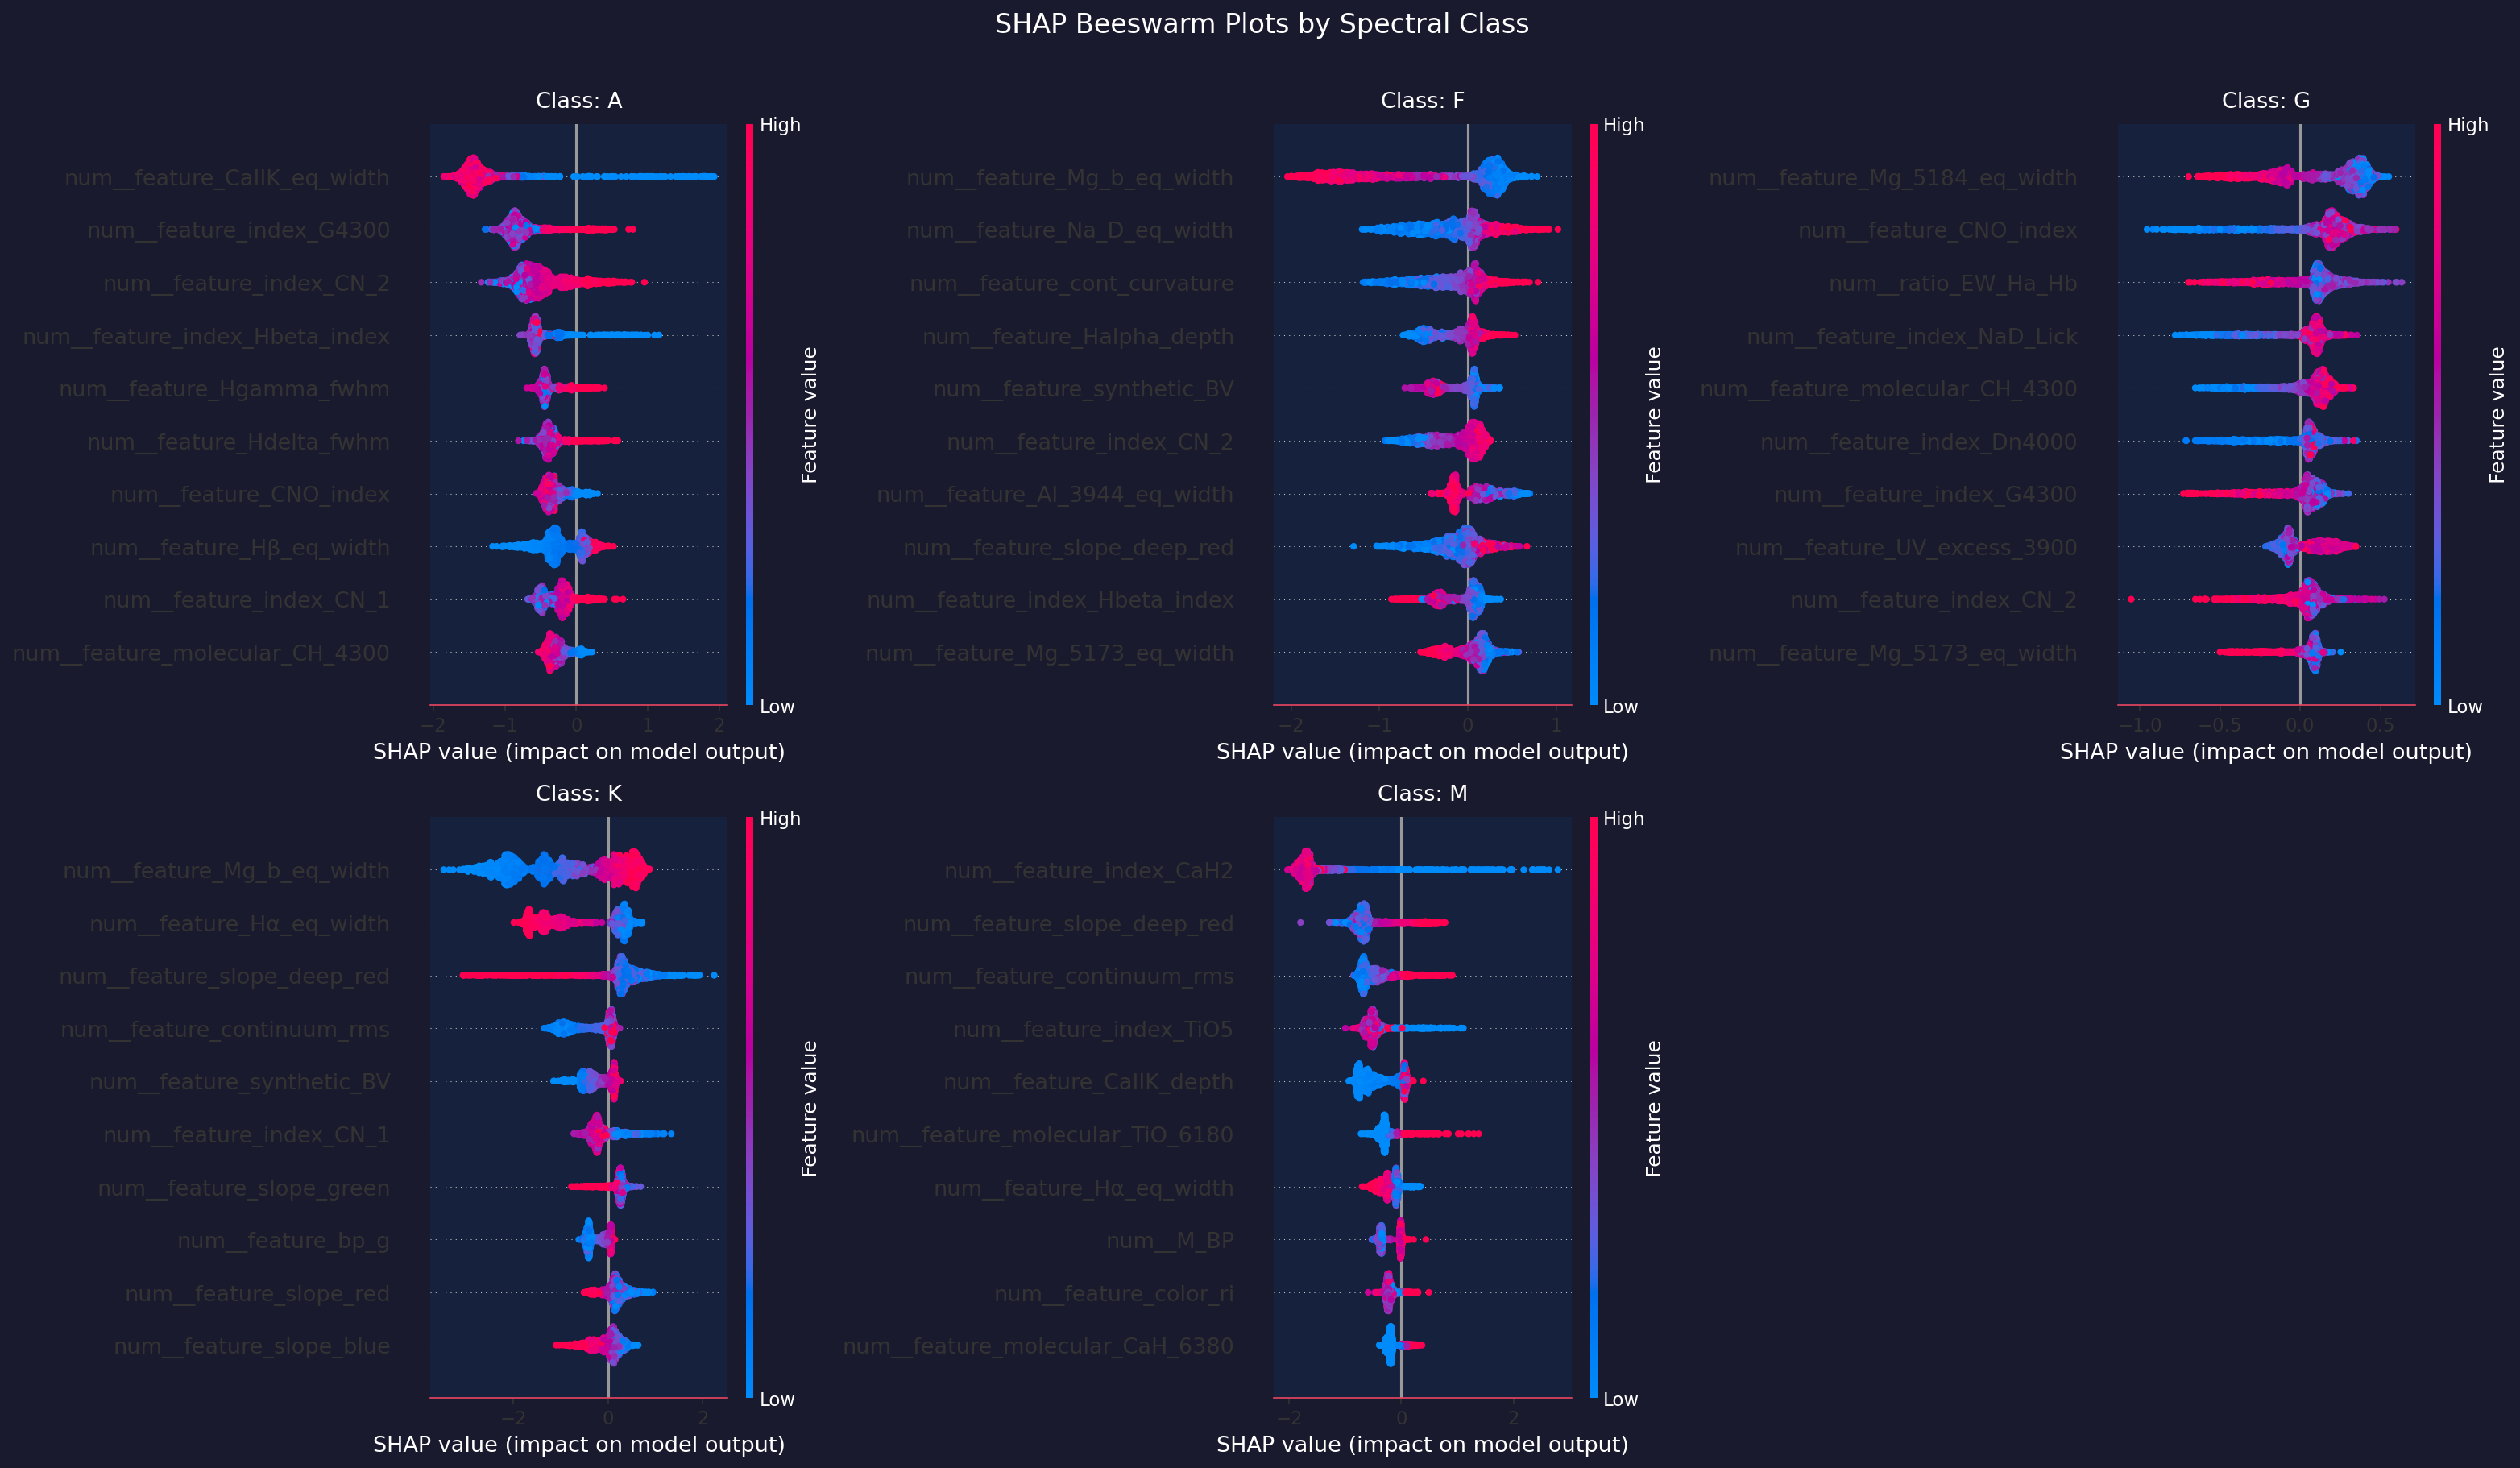
SHAP (SHapley Additive exPlanations) analysis of the reference run attributes 96.8% of the total mean |SHAP| to spectroscopic features and 3.2% to Gaia/photometric columns; 29 of the 30 most important features are spectroscopic. This suggests that the model classifies stars mainly from the same spectroscopic information that astrophysicists use, with a small but non-zero contribution of the leaked Gaia columns. (The figure of 97.9% quoted on older pages is the same share of total importance for run v5, G1.) Details: Scientific Validation and SHAP Interpretability.
ST_350k_xgb_AFGKM_v6.PCA vs XGBoost — two complementary questions
PCA ranks features by the variance they carry, SHAP by how much they help separate the classes. To keep both sides on the same data, this comparison uses the PHY-3500 PCA and the SHAP run of the same generation (G1, model v5), not the reference run:
Top SHAP features per class
Leading features per class in the reference run (read from the per-class SHAP figure of logs/shap/features_20260522T153123Z/01_data_leak/, G2):
| Class | Leading features (mean |SHAP| per class) | Physical interpretation |
|---|---|---|
| A | Ca II K EW, G4300 index, CN index, Hβ index | Weak metal lines and strong Balmer lines of hot stars |
| F | Mg b EW, Na D EW, continuum curvature | Onset of metal lines as temperature decreases |
| G | Mg I 5184 EW, CNO index, Hα/Hβ EW ratio | Gradual metal-line growth, weakening Balmer lines |
| K | Mg b EW, Hα EW, deep-red continuum slope | Strong metal lines, red continuum |
| M | CaH2 index, deep-red slope, continuum RMS, TiO5 | Molecular band signatures |
Limitations and next steps
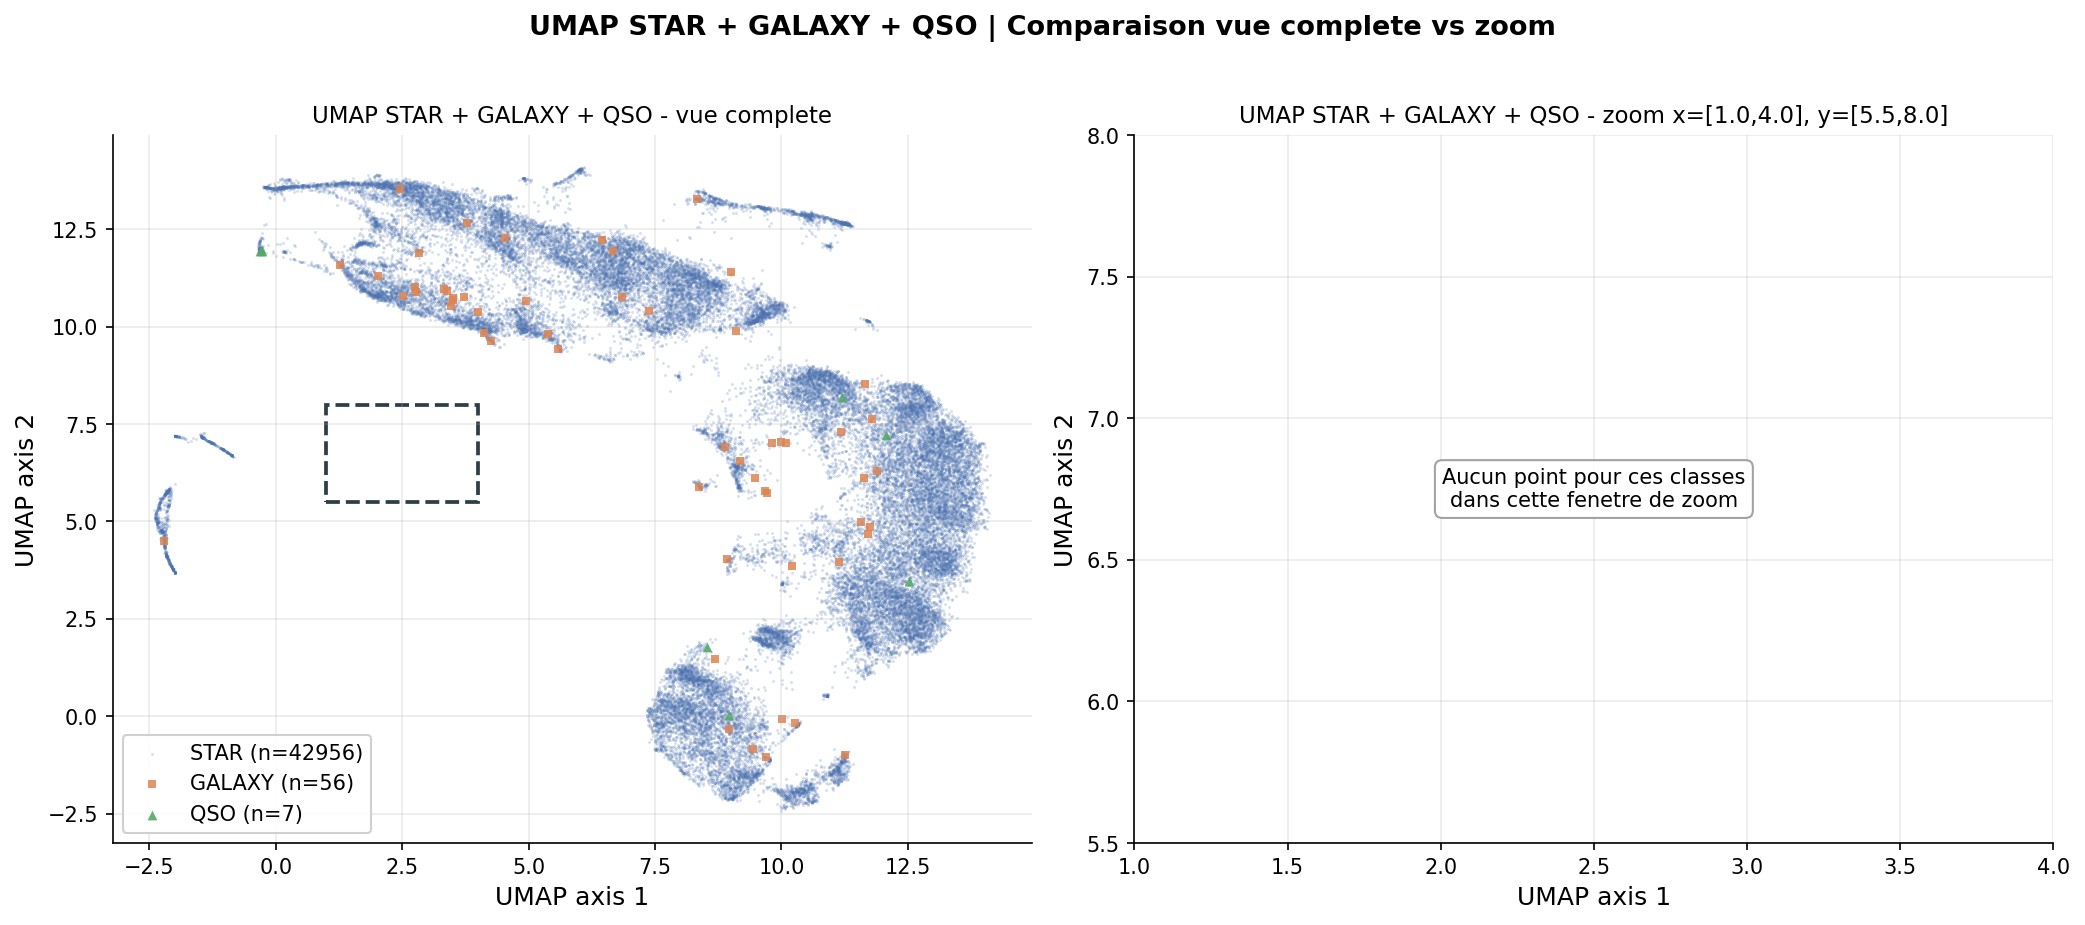
Class imbalance: in the PHY-3500 dataset (G1), galaxies (56) and QSOs (7) are too rare for HDBSCAN analysis. The classifier (G2) works on the stellar types A, F, G, K, M only.
Gaia leak: the reference classifier includes Gaia/photometric features; a fully spectroscopic reference run is still to be completed (see Current Status).
Intrinsic dimensionality: The 91 components needed for 95% variance indicate that spectral diversity is genuinely high-dimensional. The 2D projection is an extreme compression (183 → 2), and the emergence of the Harvard sequence in these two dimensions is a non-trivial result.
Next steps:
- Characterisation of the 20 HDBSCAN clusters by cross-matching with rare object catalogues (variable stars, RGB giants, spectroscopic binaries)
- Systematic hyperparameter optimisation (Optuna) on the full generation
- Anomaly analysis: intersection of HDBSCAN noise ∩ top 1% MSE autoencoder
- Extension to LAMOST DR10 (~10⁷ spectra) or SDSS