SHAP Interpretability
SHAP of the reference classifier ST_350k_xgb_AFGKM_v6 (20260522T161236Z) · XGBoost · spectro_only mode · G2, 349,998 spectra · 99 selected features · classes A / F / G / K / M.
The central finding
Current SHAP results for the reference model suggest that a small set of spectroscopic features (Mg b, CaH2, the deep-red continuum slope, Ca II K and Hα) carries most of the learned classification structure, alongside classical Balmer temperature indicators.
- 96.8% of the total mean |SHAP| comes from spectroscopic features; 29 of the 30 most important features are spectroscopic. The remainder belongs to Gaia/photometric columns (3.2%), see the Data Leakage Audit
- Ranks 1–3:
feature_Mg_b_eq_width,feature_index_CaH2,feature_slope_deep_red; Ca II K equivalent width (feature_CaIIK_eq_width) is rank 4 - This contrasts with PCA where Balmer lines dominate PC1 (the temperature axis)
"Suggest" is used deliberately — the finding is robust within this dataset and model configuration, but replication across independent surveys and model families remains future work.
SHAP vs PCA: two complementary questions
| Method | Question answered | Dominant feature | Physical result |
|---|---|---|---|
| PCA (unsupervised, PHY-3500 · G1) | What is the primary source of variance? | Balmer lines (PC1 = thermal axis, 16.9% of the variance) | Temperature T_eff dominates variance |
| XGBoost + SHAP (supervised, reference run) | What best separates spectral classes? | Mg b, CaH2, deep-red slope (ranks 1–3), then Ca II K | Mixed metal and band indicators are the most discriminative |
These results are not contradictory — they answer different questions. Temperature (Balmer) drives the most variance in spectral space. Metal and molecular-band indicators are more discriminative for class boundary decisions.
 |
|---|
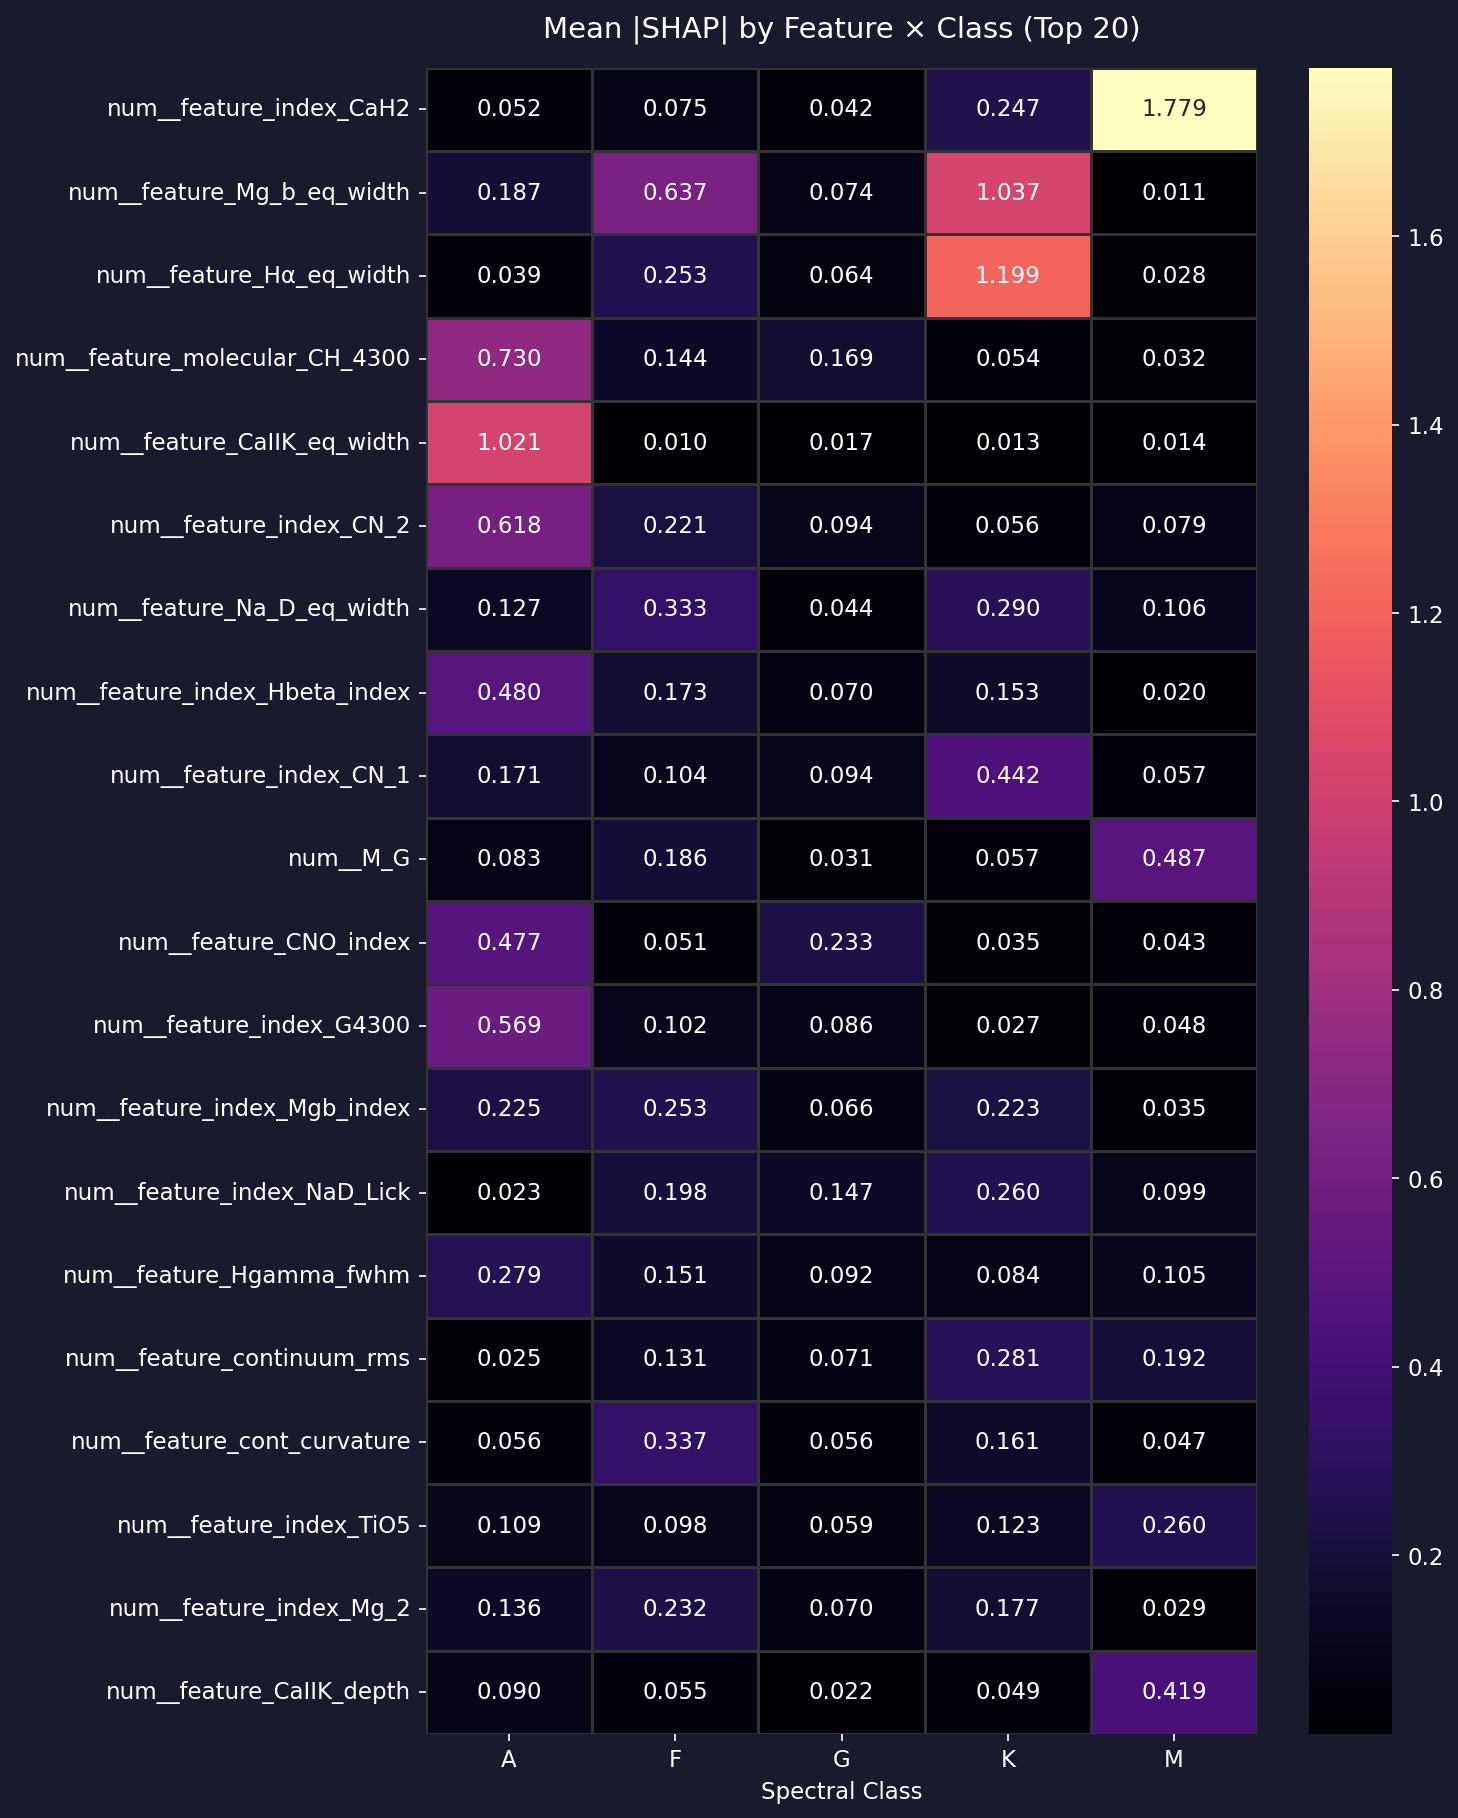
SHAP importance heatmap by feature × class — SHAP analysis features_20260305T174836Z (model v5, which also kept Gaia/photometric columns) |
Top-10 SHAP features (mean |SHAP value| across all classes)
ST_350k_xgb_AFGKM_v6.The share of spectroscopic features is reported above (96.8% of the summed mean |SHAP|, not a share of the top-30). Gaia absolute magnitudes (M_G, M_BP, M_RP) and ag_gspphot are among the selected features and carry the rest, so the claim "no Gaia-derived feature is used" does not hold for this run.
 |
|---|
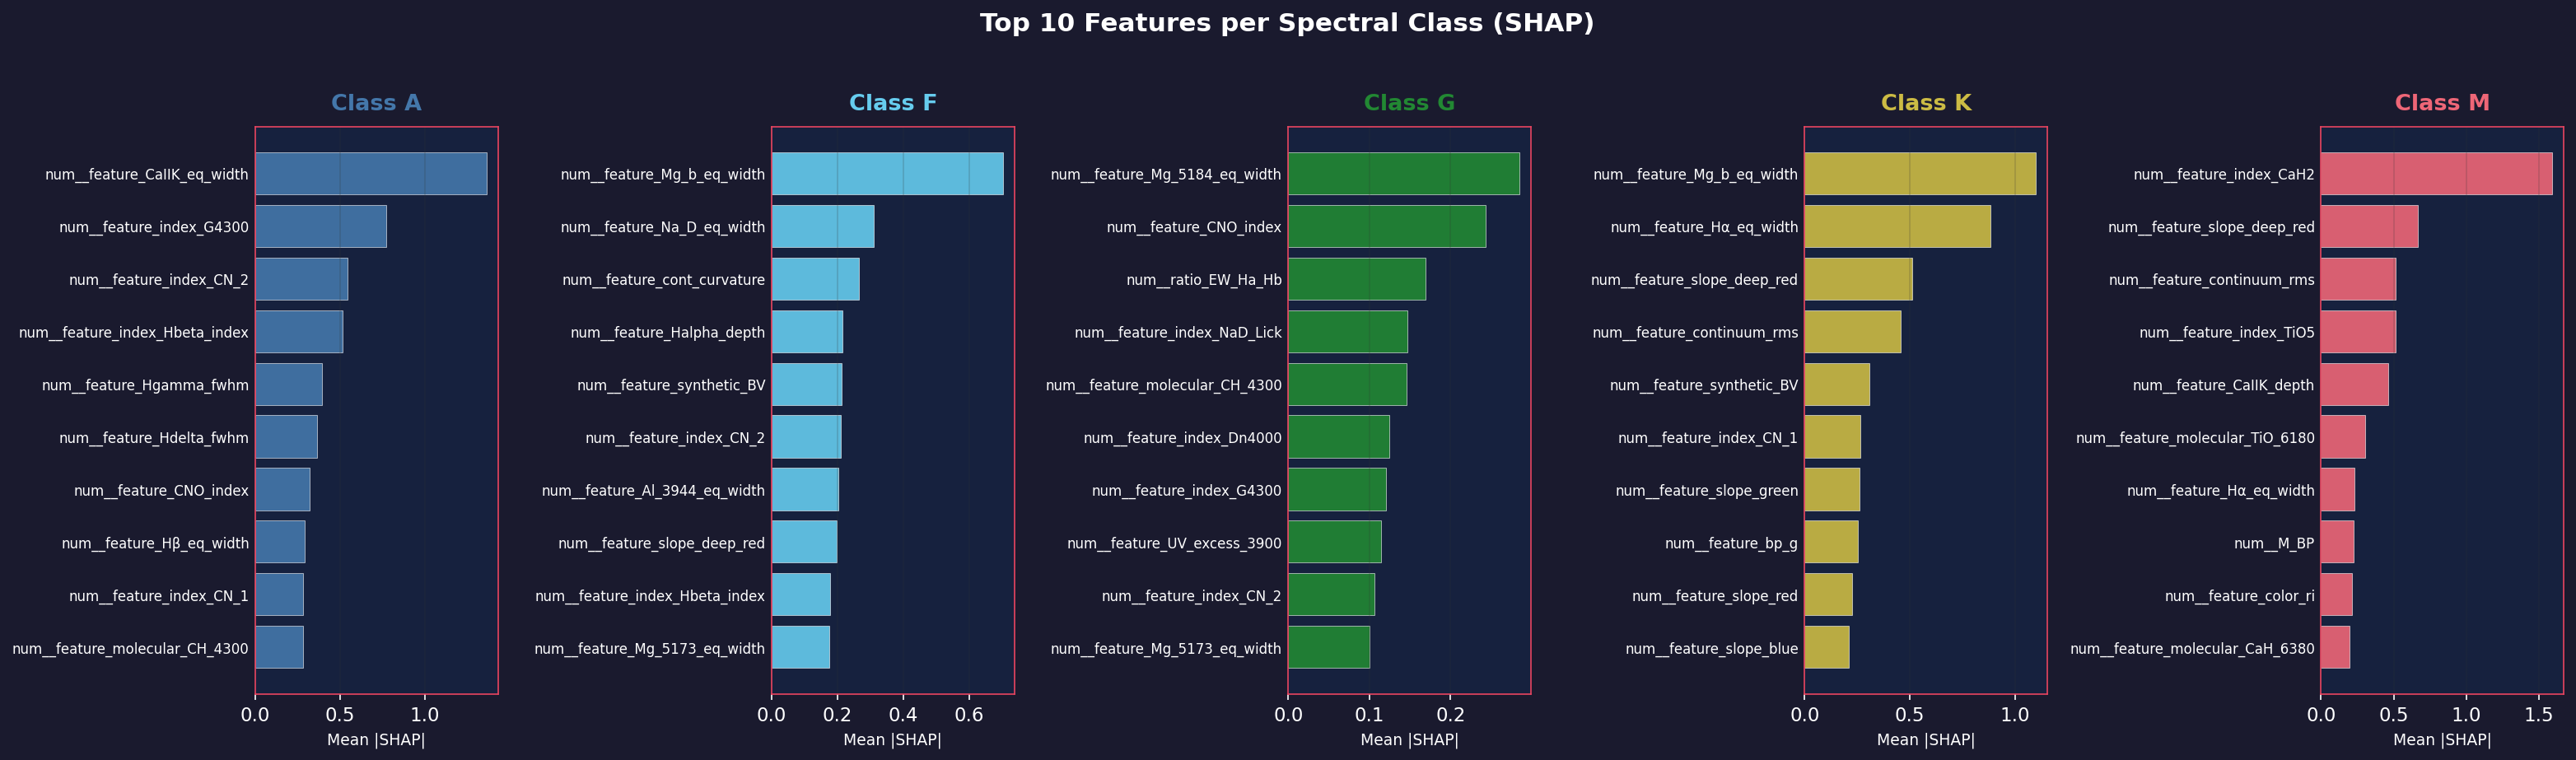
Class-specific SHAP importance — top 10 features per spectral type, reference run v6 (01_data_leak) |
Per-class dominant features
Top three features of each class in the figure above (reference run v6, mean |SHAP| per class). The ranking is read off the figure: shap_feature_importance.csv holds the global importance only, with no per-class table.
| Class | Top three features (in order) | Also in the class top 10 |
|---|---|---|
| A | Ca II K equivalent width, G4300 index, CN₂ index | Hβ index, Hγ and Hδ FWHM |
| F | Mg b equivalent width, Na D equivalent width, continuum curvature | Hα depth, Al 3944 equivalent width |
| G | Mg 5184 equivalent width, CNO index, EW(Hα)/EW(Hβ) ratio | Na D Lick index, Dn4000 |
| K | Mg b equivalent width, Hα equivalent width, deep-red slope | bp_g (broadband colour) |
| M | CaH2 index, deep-red slope, continuum RMS | TiO5 index, M_BP (Gaia/photometric), color_ri |
Two readings follow, both suggestive rather than established. Different features lead each class, and the leaders are not the textbook temperature indicators one might expect for every class (for A stars, Ca II K and the G4300 band come before the Balmer measurements). Gaia/photometric or colour columns reach the top 10 of classes K and M (see Data Leakage Audit). No per-class physical interpretation is claimed here; that needs an expert reading of the SHAP dependence plots.
Physical validation: Ca II K vs [Fe/H]
The correlation between Ca II K prominence (a Ca II K descriptor; its equivalent width ranks 4th in the reference run) and Gaia DR3 [Fe/H] is shown below. It is a descriptive check of the Ca II K descriptor against an external metallicity, not a validation of the SHAP ranking.
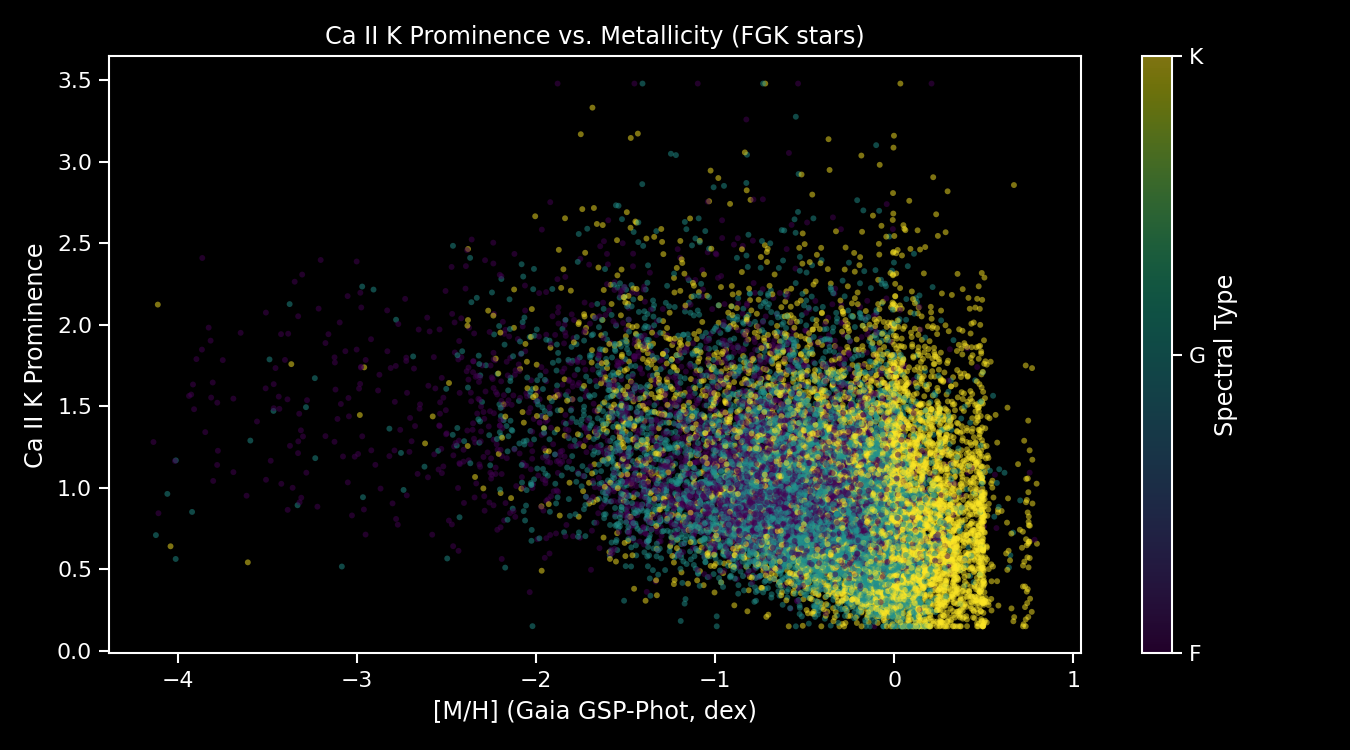
Ca II K prominence vs Gaia DR3 [Fe/H] — G1 figure, kept as a descriptive check
PCA vs XGBoost: why the difference matters
PCA: maximises total variance    → Balmer / temperature axis (PC1, G1)
XGBoost: minimises class error   → Mg b, CaH2, deep-red slope, then Ca II K (v6, G2)
The two analyses use different data (PCA: G1; SHAP: the v6 run on G2) and answer different questions, so the comparison is qualitative.
- PCA follows the direction of maximum variance in the sample, which is thermal.
- XGBoost + SHAP shows which features the trained model relies on to separate the five classes. Hα equivalent width is rank 5 and Ca II K equivalent width rank 4, so the reference run does not support a simple "Ca II outranks Balmer" statement. What it shows is that Mg b, the CaH2 band and the deep-red slope come first.
- Why those features rank high is not tested here. Explanations such as metallicity-at-fixed-temperature remain hypotheses.
Known limitations of this SHAP analysis
-
Model-specific: SHAP values reflect the decision structure of a single XGBoost model. Different model families (neural networks, random forests) may yield different rankings.
-
Ca II H&K and chromospheric activity: These lines respond to both metallicity and stellar chromospheric activity (e.g., active M dwarfs show Ca II emission). The SHAP finding conflates these two physical effects.
-
Single train/test split: Bootstrapped SHAP stability across multiple splits has not been assessed in the current version.
-
Gaia/photometric columns: The reference model includes four Gaia/photometric features (
M_G,M_BP,M_RP,ag_gspphot). A SHAP analysis of a model without them is not available: v7 was trained without them, but that run is partial and no complete spectro-only reference run exists yet. See the Data Leakage Audit.
See also
- Classification Performance — balanced accuracy and per-class metrics of the reference run
- Feature Catalogue — all 183 features documented
- PCA — Physical Interpretation — the complementary unsupervised result
- Known Limitations — full list of documented limitations