Scientific Validation
This page documents the checks that AstroSpectro uses to tell physically meaningful results from algorithmic artefacts. It covers two data generations that are never mixed: feature-versus-theory tests and SHAP attribution on the 350k-spectrum generation used by the reference classifier (G2), and the negative control and UMAP coherence test on the PHY-3500 dimensionality-reduction dataset (PHY-3500 · G1 · 43,019 spectra).
G2 — feature validation logs/validation/features_20260522T153123Z/ · SHAP of the reference classifier ST_350k_xgb_AFGKM_v6 (logs/shap/features_20260522T153123Z/01_data_leak/).
G1 — PHY-3500 dimensionality-reduction runs (UMAP/t-SNE reference run), feature validation logs/validation/features_20260305T174836Z/.
Key results
Feature-versus-theory checks, G2 (features_20260522T153123Z, as written by notebooks/03_scientific_validation.ipynb):
| Check | Measured correlation | Matches theory (pipeline verdict) |
|---|---|---|
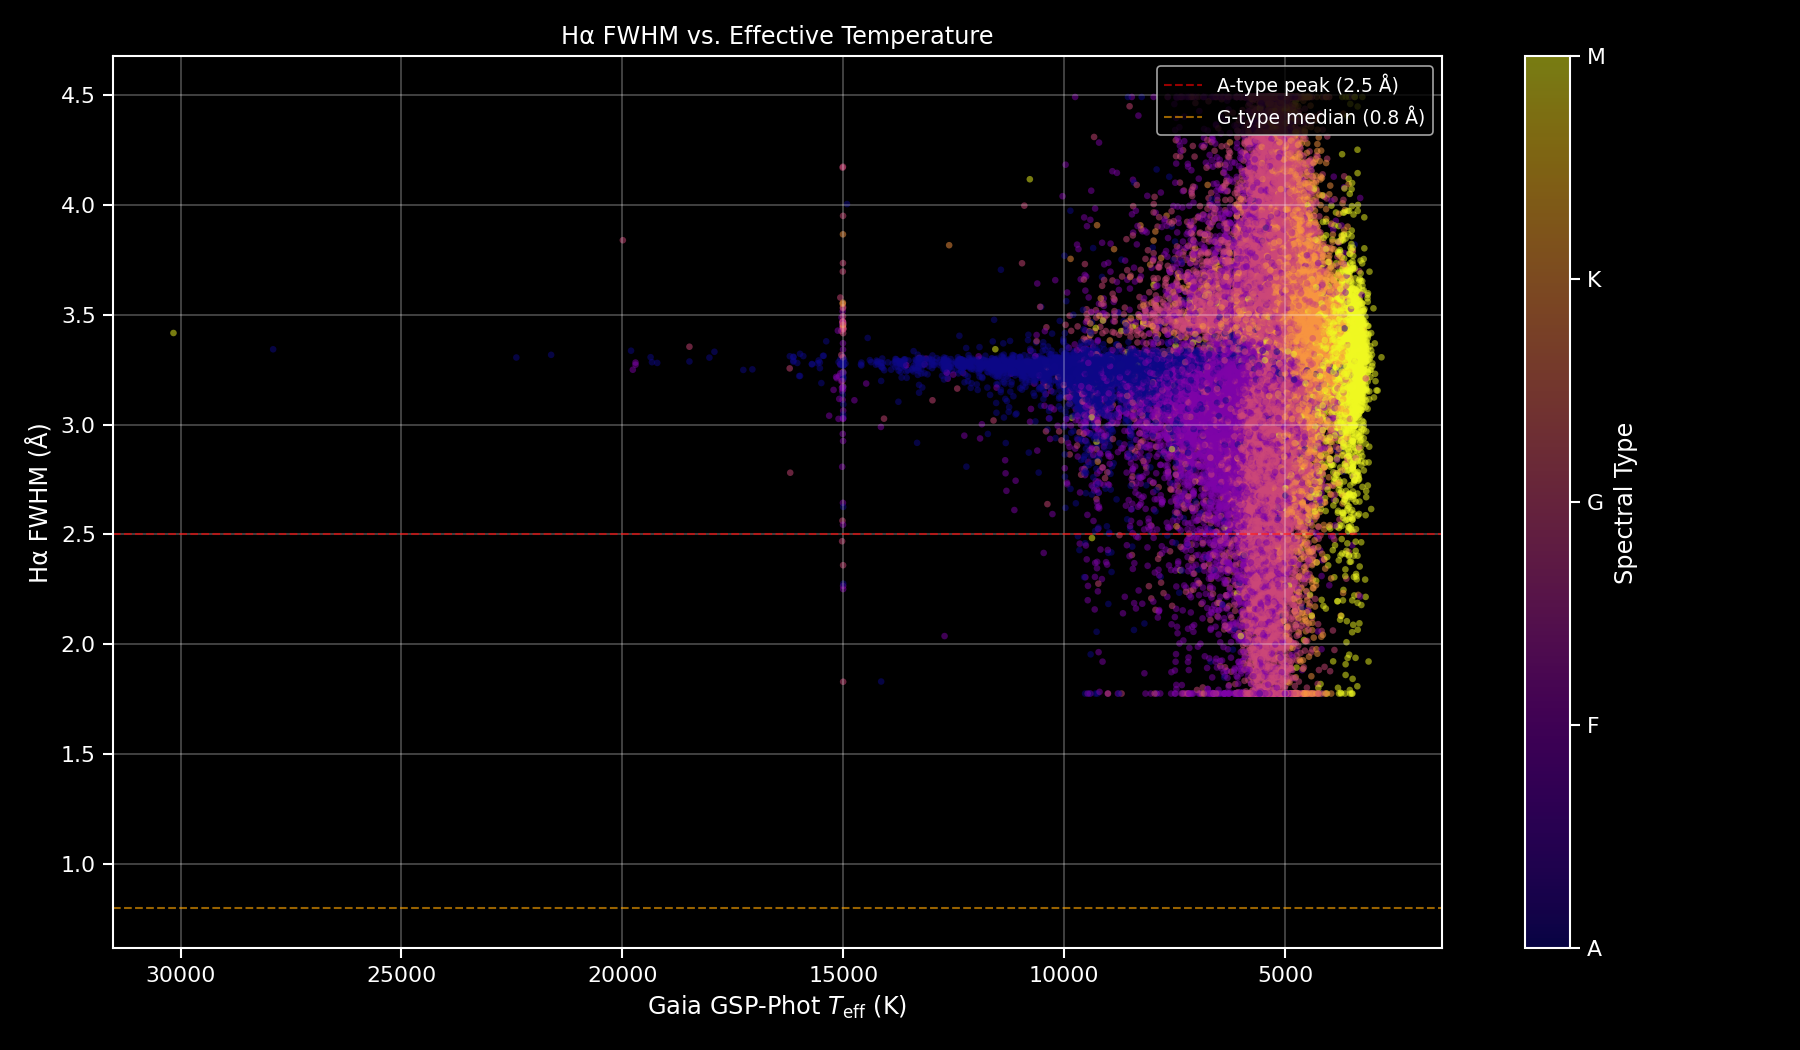
| Hα FWHM vs Teff | ρ(Teff,FWHM)=-0.397 | false |
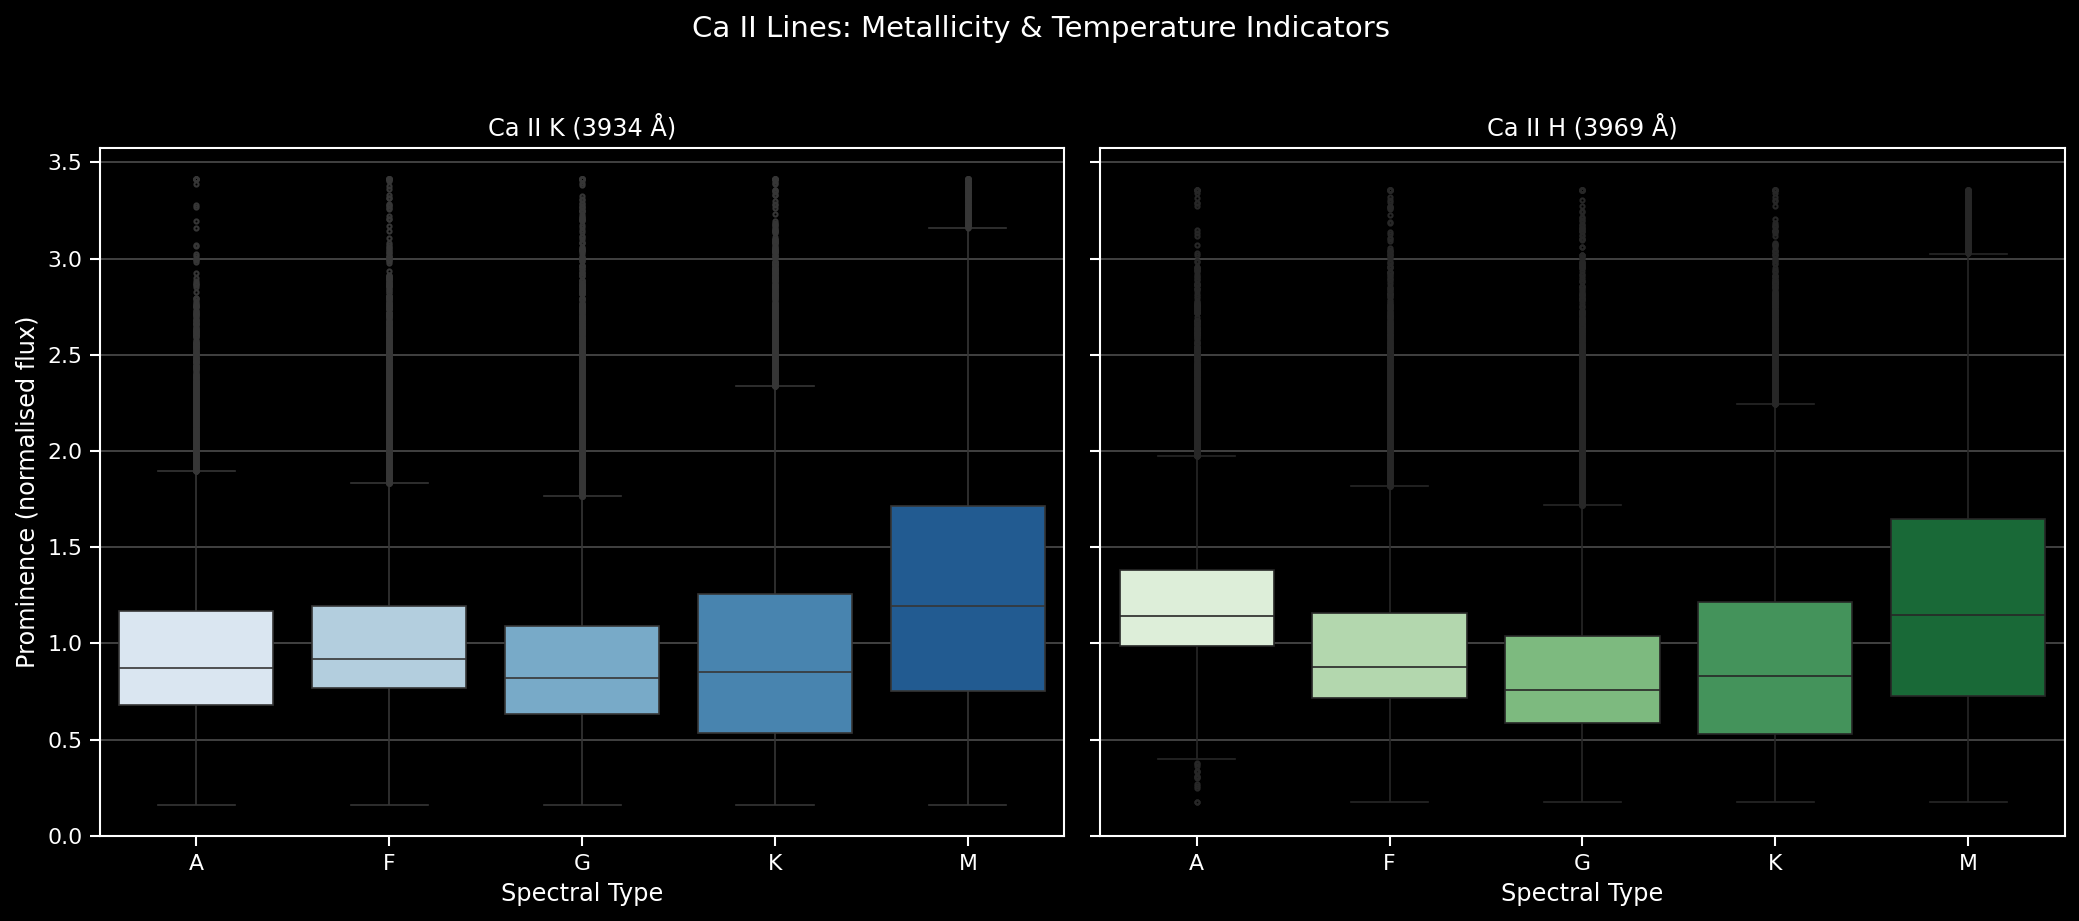
| Ca II K prominence vs spectral type / [M/H] | ρ(type,CaK)=+0.041, ρ([M/H],CaK)=N/A (spectro_only) | true |
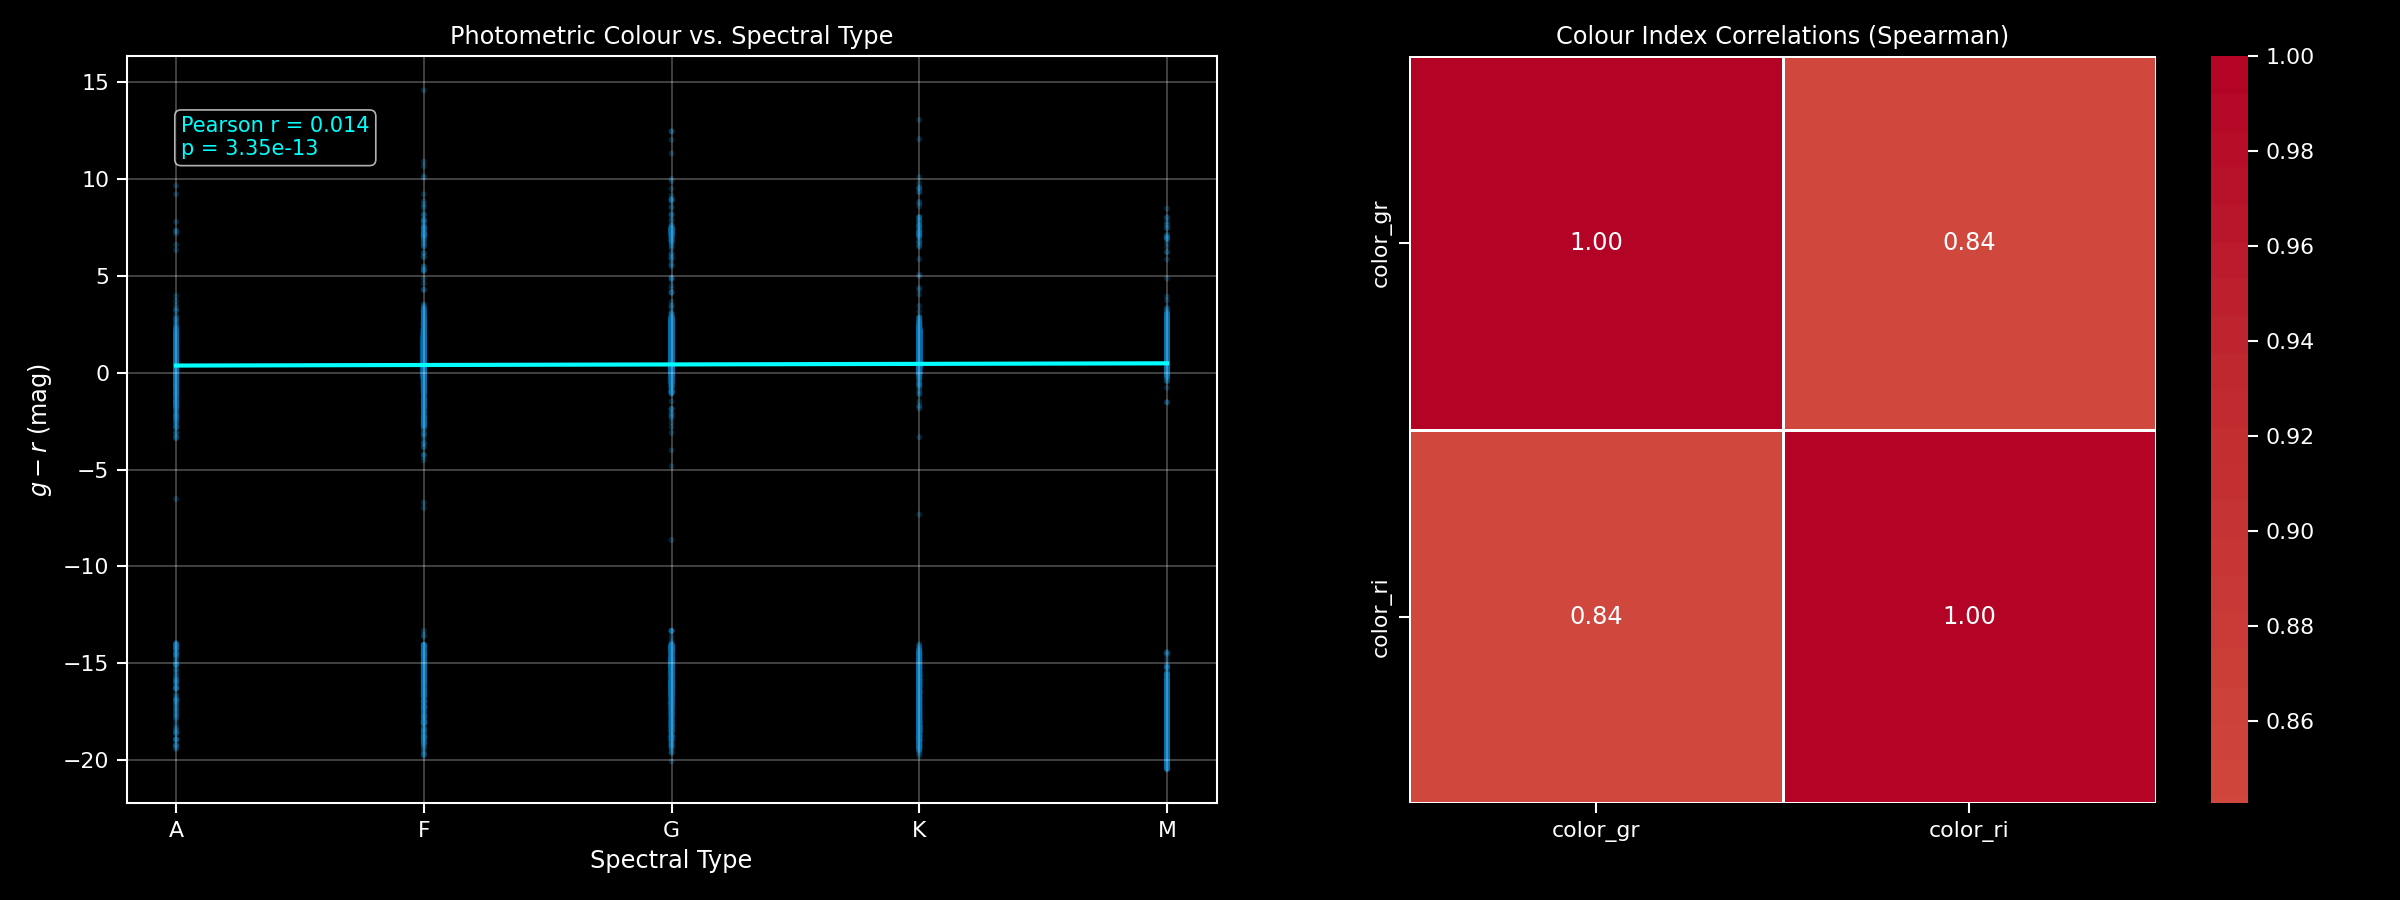
| Colour g − r vs spectral type | r(type,g−r)=+0.014 | true |
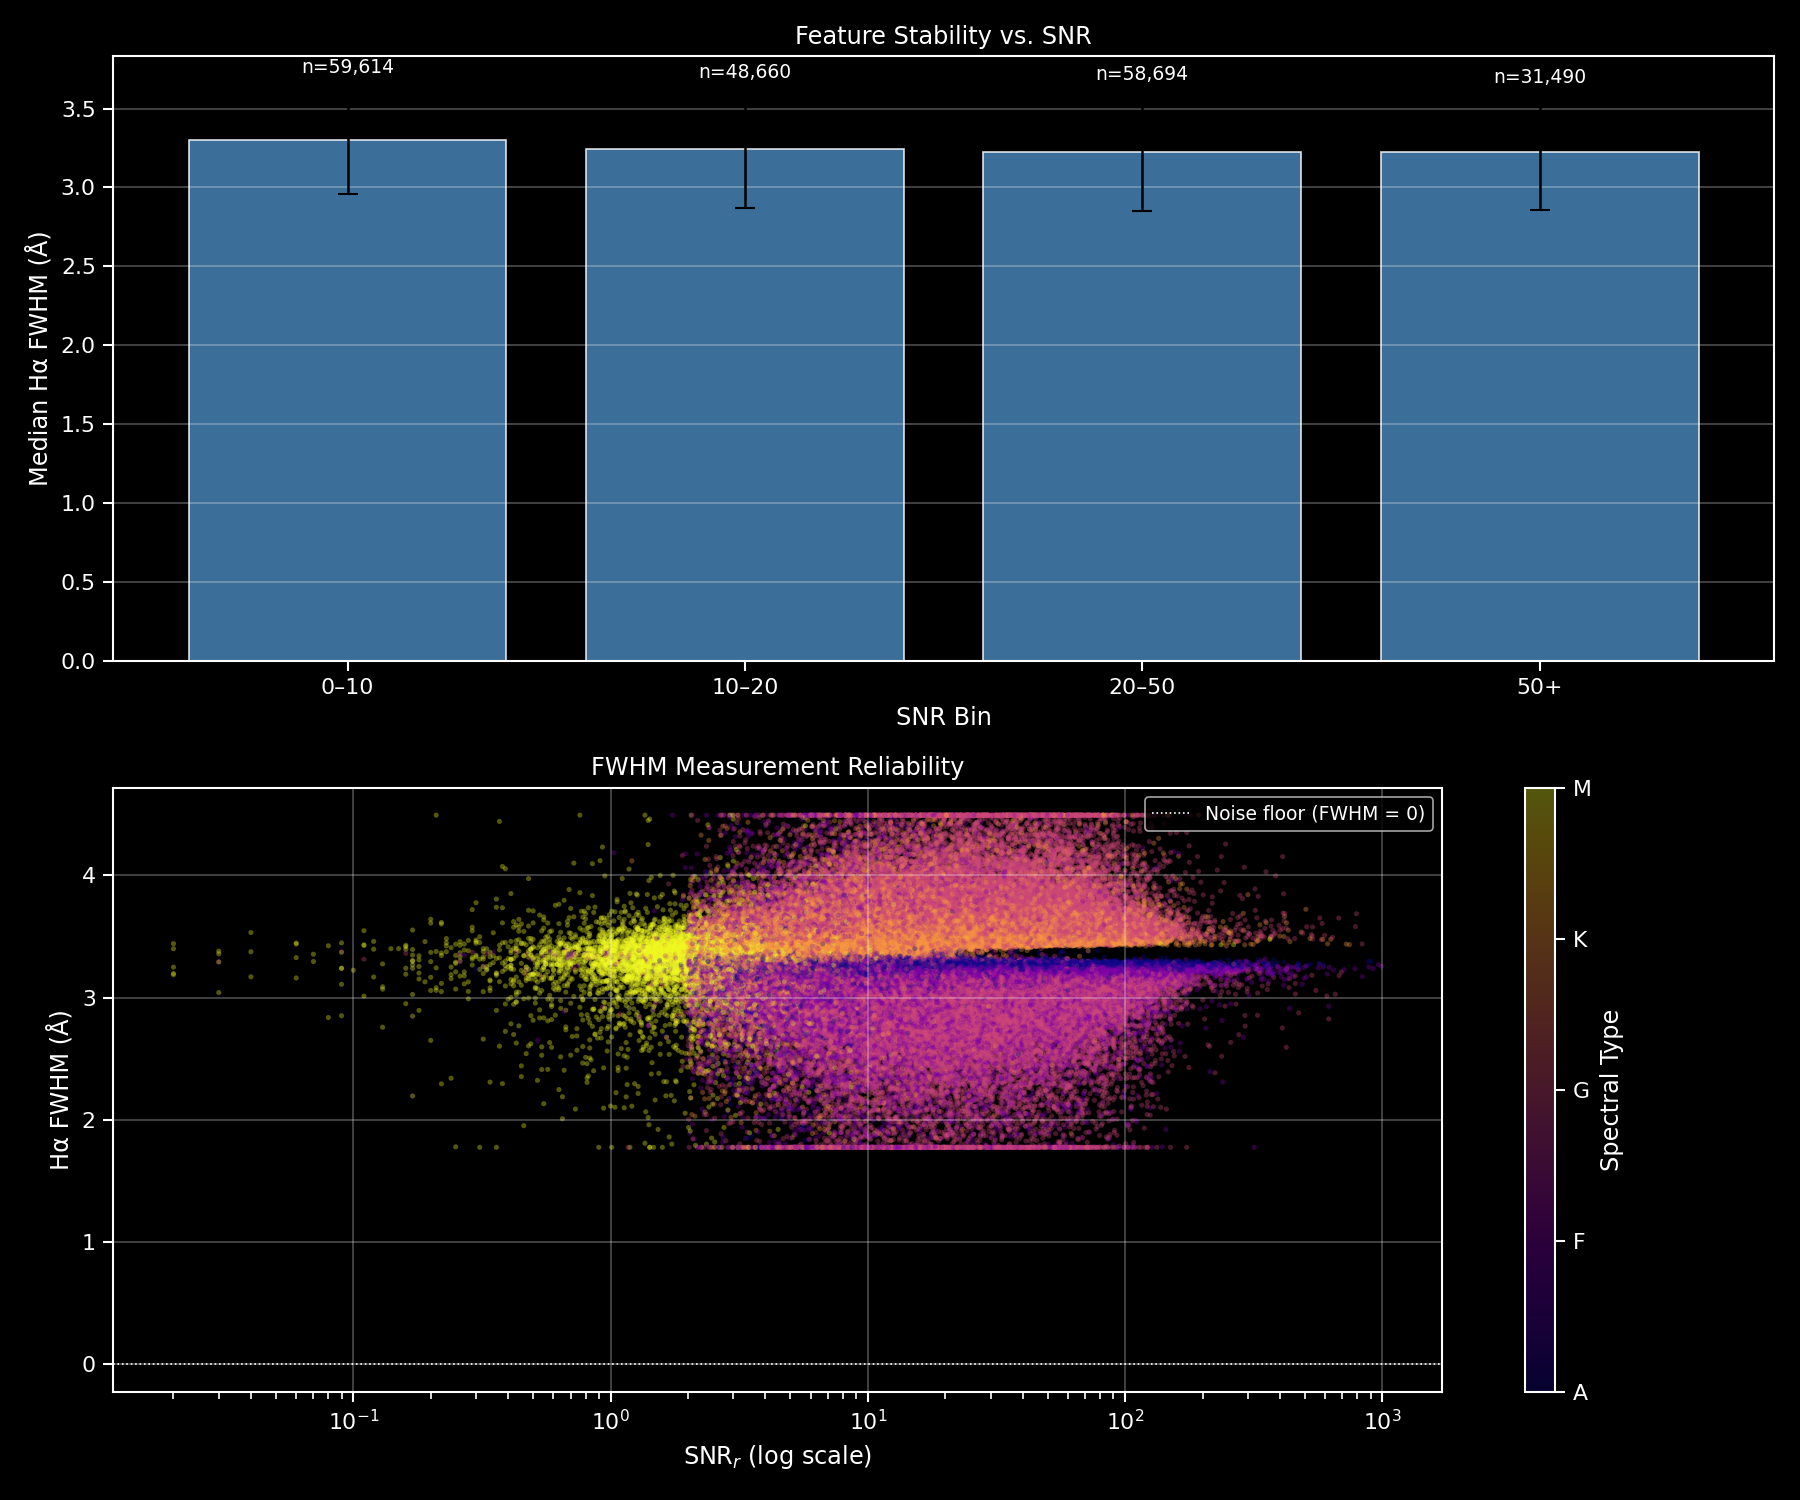
| Feature residual vs SNR | r(SNR,residual)=-0.006 | true |
SHAP attribution of the reference classifier, G2: 96.8% of the total mean |SHAP| goes to features of the Physical (spectroscopic) category, and 29 of the 30 most important features belong to that category.
Feature-versus-theory tests (G2)
Result
The validation notebook compares four extracted quantities with the trend expected from stellar astrophysics and writes one row per test to validation_summary.csv. The pipeline marks three of the four tests as consistent with theory; the Hα FWHM test fails.
Interpretation
- Hα FWHM — the expected ordering of the line width with temperature is not recovered. The note written by the pipeline attributes this to the limited spectral resolution of LAMOST: at low resolution the measured FWHM is dominated by the instrumental profile rather than by the intrinsic line width.
- Ca II K prominence — the trend with spectral type has the expected sign but is very weak. The metallicity test cannot be run on this generation: the run is
spectro_onlyand no [M/H] column is available (N/Aabove). - Colour g − r — the sign of the trend is correct, but the correlation coefficient is close to zero.
- SNR — the residual of the features shows no measurable dependence on SNR, which suggests that feature extraction is not driven by data quality.
Caveat
"Matches theory" is the boolean written by the notebook, not an independent statistical test: a correlation coefficient close to zero is accepted as a pass when the sign is right. These tests therefore do not contradict stellar physics; they do not confirm it quantitatively. In the colour–colour panel of the composite figure, a group of points lies far outside the physical colour range, which points to placeholder values in the catalogue magnitudes; the g − r test should be re-run once these values are masked.
SHAP attribution of the reference classifier (G2)
Result
SHAP is computed on the reference classifier (ST_350k_xgb_AFGKM_v6, 99 selected features). The share of the total mean |SHAP| carried by spectroscopic features is 96.8%; the remaining 3.2% goes to Gaia/photometric columns.
Interpretation
The classifier relies overwhelmingly on absorption-line and continuum descriptors, i.e. on the same information a spectroscopist uses to assign a type. The ranking itself is documented on SHAP Interpretability.
Caveat
This percentage is a share of total importance, not a fraction of the top-30 list, and it is specific to one run. The value of the earlier run v5 on the PHY-3500 generation (97.9%, G1) is often quoted on older pages; it must not be attached to the reference run.
Run v6 (ST_350k_xgb_AFGKM_v6) was trained with spectro_only enabled, but its 99 selected features include 4 Gaia/photometric columns (M_G, M_BP, M_RP, ag_gspphot). Its metrics are therefore not purely spectroscopic; see the Data Leakage Audit.
Evaluation protocol of the classifier
Performance figures are measured on a held-out test set that the model never sees during training. In SpectralClassifier.train_and_evaluate (src/pipeline/classifier.py):
| Step | Implementation | Role |
|---|---|---|
| Train/test split | StratifiedShuffleSplit(n_splits=1, test_size, random_state) | Keeps class proportions identical in both sets |
| Group-aware split (optional) | StratifiedGroupKFold / GroupShuffleSplit when use_groups=True | Prevents spectra of the same group from appearing in train and test |
| Cross-validation | StratifiedKFold(cv_folds, shuffle=True) or RepeatedStratifiedKFold | Used only when a hyperparameter search (search="grid" / "random") is requested |
| Calibration (optional) | CalibratedClassifierCV (sigmoid or isotonic), by CV or on a dedicated hold-out | Makes predicted probabilities interpretable as confidences |
The reference run reused the hyperparameters of an earlier search (its notes field reads: Full dataset retraining — 350k spectra — best params from v5 — spectro_only — isotonic calibration), so its cross-validation happened in that earlier run. Its test set holds 60,947 spectra. Full metrics: Classification Performance and Model Card.
Negative control and UMAP coherence (PHY-3500 · G1 · 43,019 spectra)
These two tests belong to the dimensionality-reduction study and use the G1 generation only.
Negative control
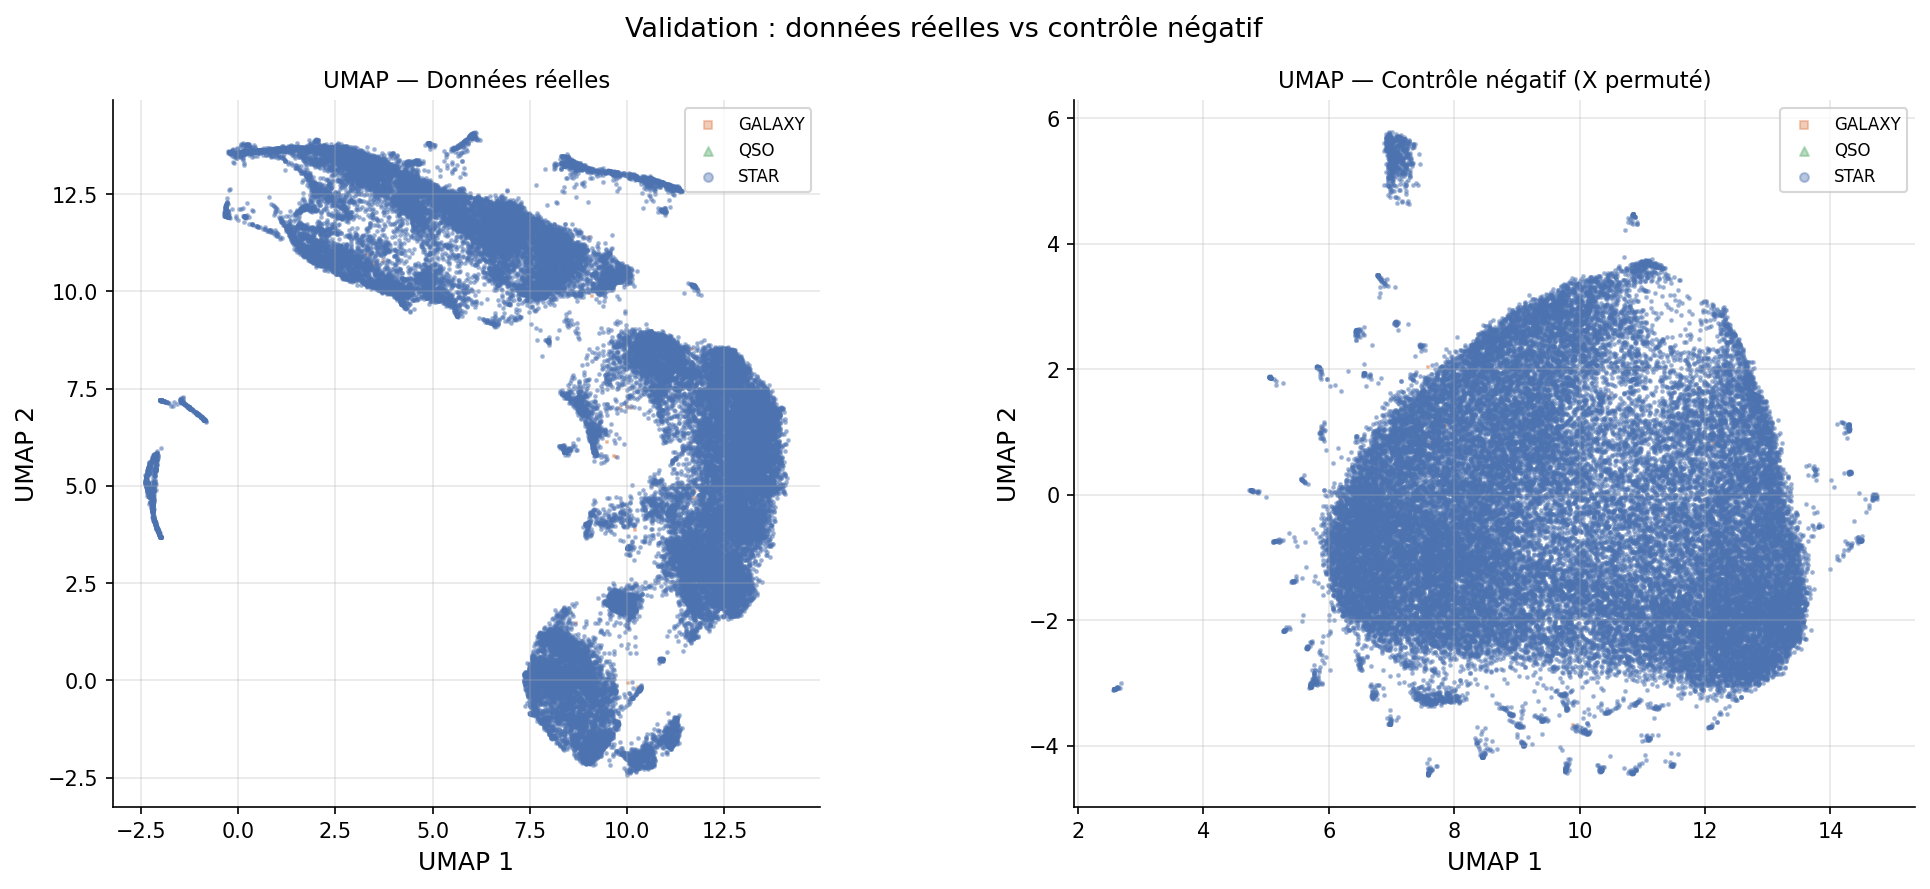
Result. UMAP applied to the same feature matrix with each column independently permuted (EmbeddingEngine.negative_control, src/dimred/embedding.py, which destroys the correlations between features while keeping their marginal distributions) produces a homogeneous cloud with no structure.
Interpretation. The continuous sequence observed on the real data is carried by the joint behaviour of the features, i.e. by the physics of the spectra, and is not produced by UMAP itself.
Caveat. The control is qualitative (visual comparison): the run report stores only summary statistics of the permuted embedding, no structure score.
Supervised / unsupervised coherence
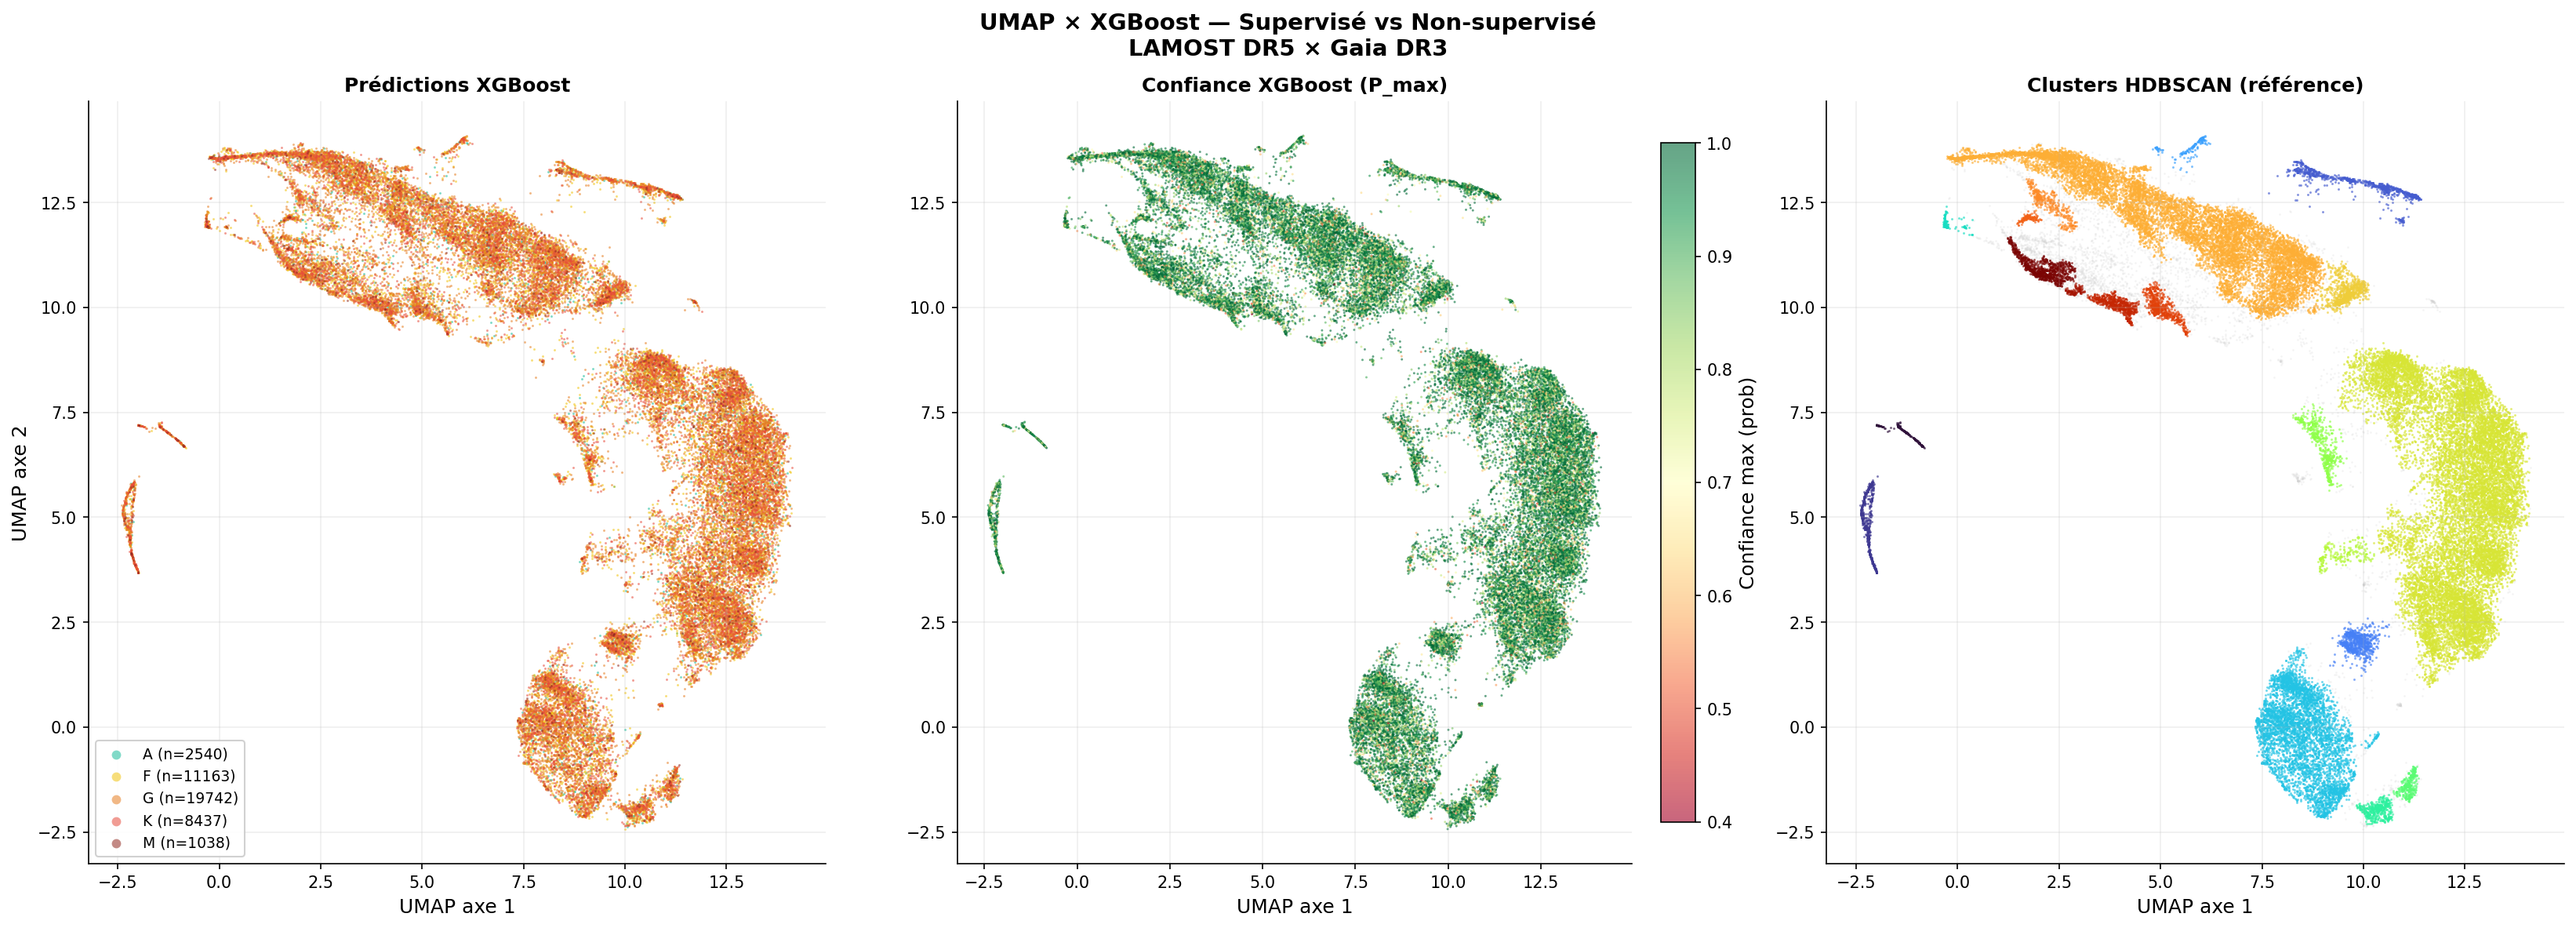
Result. The predictions of an XGBoost model projected onto the G1 UMAP embedding follow its geography: hot types on one side, cool types on the other, transitions where the embedding is continuous. The projected model is v5 (ST_100k_xgb_AFGKM_v5), not the reference classifier; its median prediction confidence on the projected spectra is 96.3% (42,920 predictions).
Interpretation. A supervised model and an unsupervised projection built on the same features recover the same ordering, which suggests that both follow the temperature sequence rather than an artefact of either method.
Caveat. This is a qualitative agreement on G1 with an older model; it is not a validation of the reference run.
Ca II K and metallicity (G1)
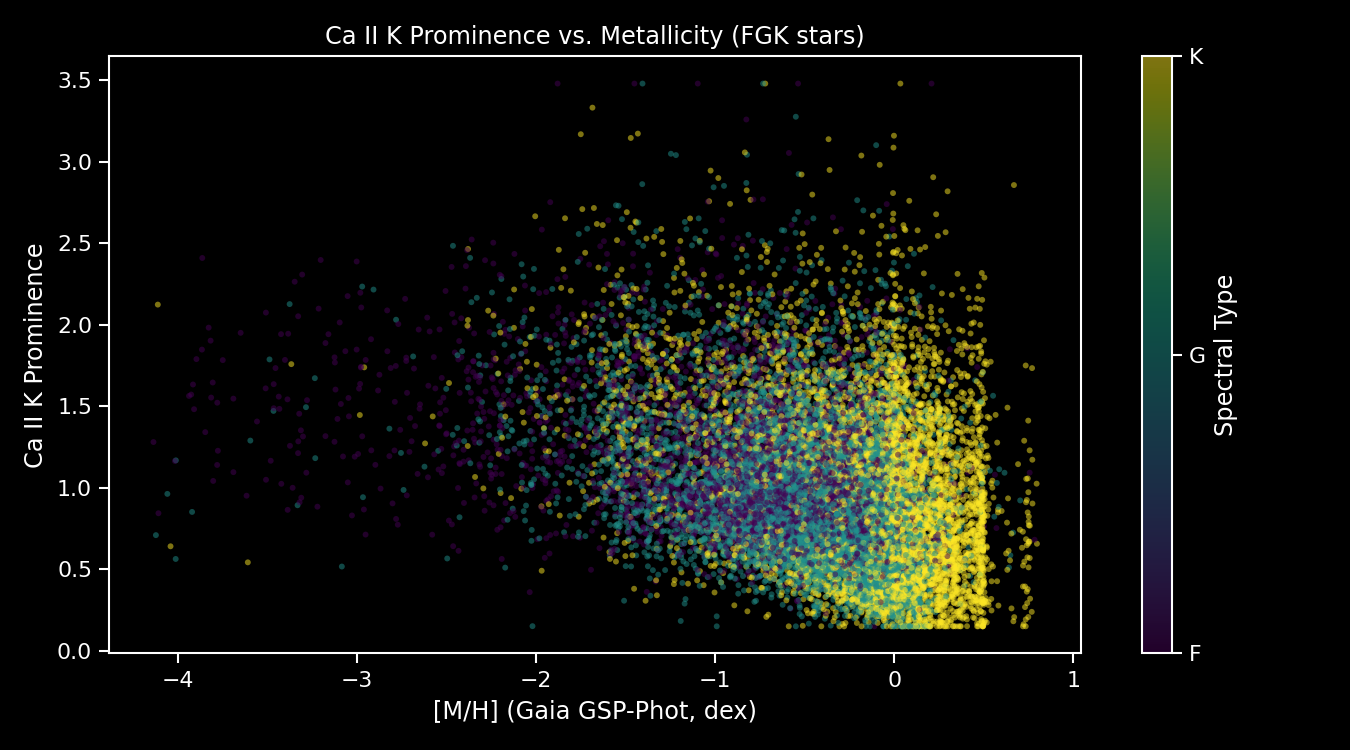
On G1, where Gaia metallicities are available, the Ca II K test gives ρ(type,CaK)=+0.040, ρ([M/H],CaK)=-0.324. The sign of the metallicity correlation is inverted with respect to expectation: the prominence decreases as [M/H] increases, whereas metal-rich stars should show stronger Ca II K. This result is open: it may come from the prominence definition, from the temperature dependence of Ca II K dominating the metallicity signal, or from the Gaia metallicities themselves. It cannot be checked on G2 (spectro_only, no [M/H]).
Limitations of these checks
- The feature tests are univariate correlations; they do not test the joint behaviour of the descriptors that the classifier uses.
- Two of the four "passing" tests rest on correlation coefficients close to zero.
- The metallicity dimension is untested on the reference generation.
- No external benchmark (another survey's classification of the same stars) is part of the exported results.
See Limitations for the project-wide list.