DESI DR2 BAO
This page documents the BAO half of the data: 13 DESI DR2 Gaussian BAO measurements (the ALL_GCcomb combination), each a distance divided by the sound horizon rd, together with their covariance.
Observables
| Type in the file | Observable | Model prediction (flat universe) |
|---|---|---|
DM_over_rs | DM/rd | D_C(z) / r_d, with DM = DC for Ωk = 0 |
DH_over_rs | DH/rd | c / (H(z) r_d) |
DV_over_rs | DV/rd | [ z D_M² D_H ]^(1/3) / r_d |
rd is fixed to 147.09 Mpc for every model and every sample. It is not fitted and no uncertainty on it is propagated — limitation 1 on Known Limitations.
File format and loading
The mean file lists measurements as z value quantity, and the covariance file holds the full matrix. The loader reads the mean file as a token stream and accepts a row only when it is two numbers followed by one of the three known quantity names; it then checks that the covariance shape matches the number of measurements and raises an error otherwise.
# src/xi_protocol1b_bao_run.py
from pathlib import Path
from xi_protocol1b_bao_run import load_desi_bao

z_bao, types, values, cov, cov_inv = load_desi_bao(
    Path("data/raw/desi_gaussian_bao_ALL_GCcomb_mean.txt"),
    Path("data/raw/desi_gaussian_bao_ALL_GCcomb_cov.txt"),
)
The two files can be fetched with python scripts/download_data.py, which downloads them from the desi_bao_dr2 folder of the public CobayaSampler/bao_data repository.
Normalised residuals
The figure shows (data − model)/σ for each BAO point and each model, using the best sampled point of each chain. Residuals are normalised by the marginal standard deviation of each measurement, which is the square root of the diagonal of the covariance; the likelihood itself uses the full matrix, so the plot is a visual guide rather than the χ².
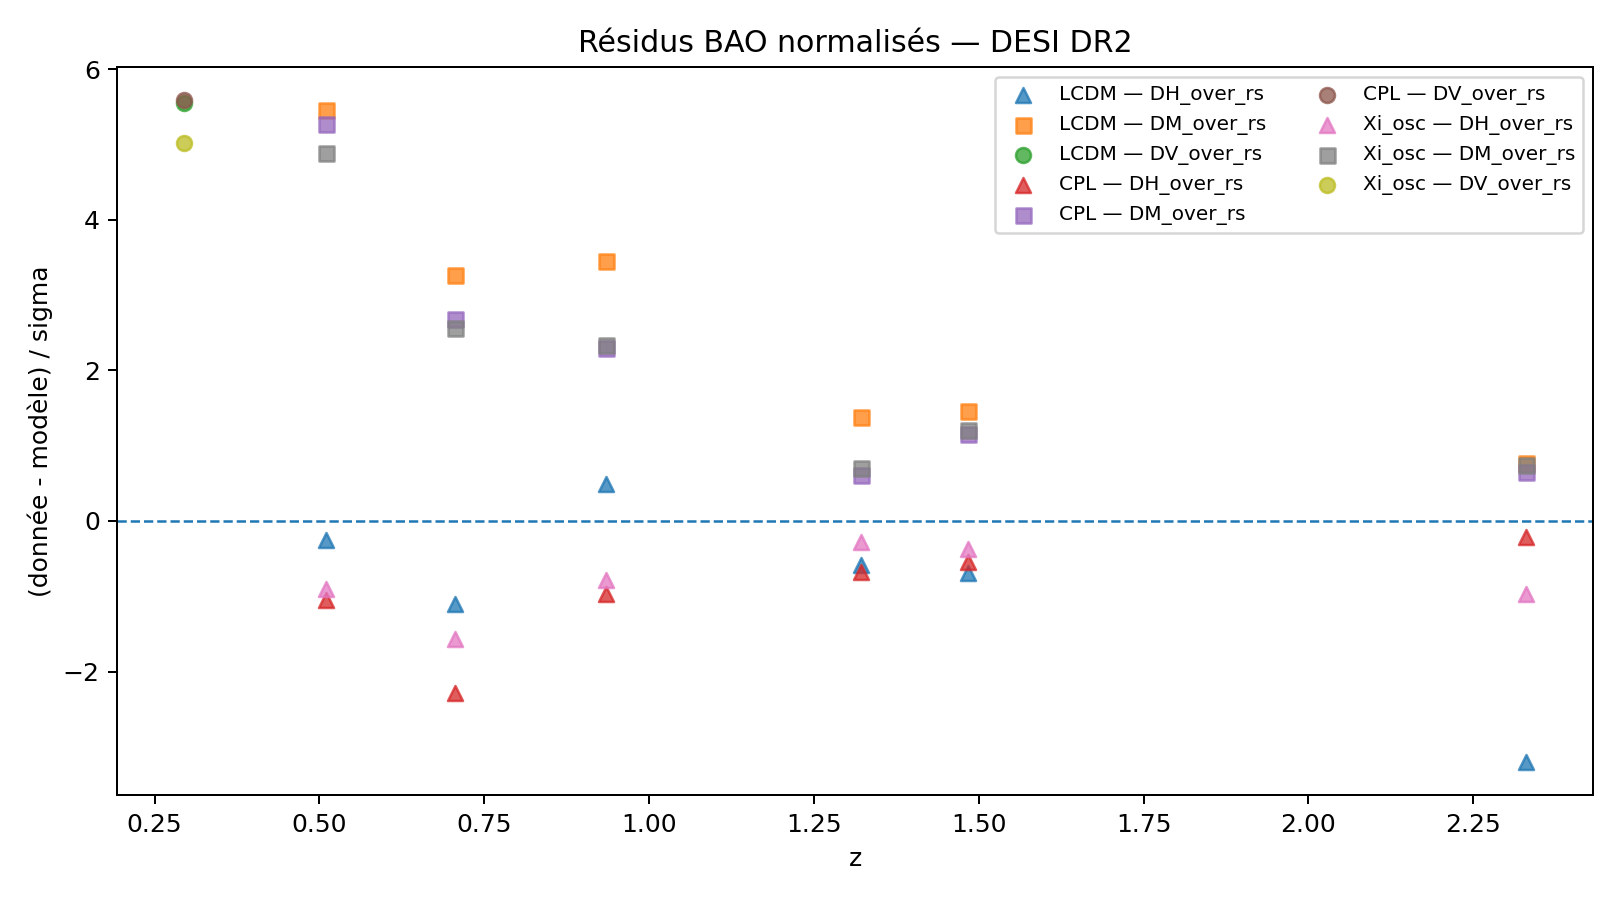
Figure 1 — Normalised residuals of the DESI DR2 BAO measurements. Symbols distinguish DM/rd (squares), DH/rd (triangles) and DV/rd (circles).
The DM/rd and DV/rd residuals at the lowest redshifts are large and positive for all three models, and the models differ most visibly in DH/rd at the highest redshift, where ΛCDM is furthest from zero. Because the points are strongly correlated, a large marginal residual does not translate directly into a large χ² contribution.